
Create a custom Options watchlist using ThinkOrSwim in Excel. This week’s Journal Entry will be a bit nerdier than usual as I take a close look at my custom Options watchlist – an Excel Spreadsheet that pulls live data from my ThinkorSwim trading platform. I will dissect my watchlist spreadsheet and show how I calculated the most important data points.
Investing should be more like watching paint dry or watching grass grow.
– Paul Samuelson
If you want excitement, take $800 and go to Las Vegas.
Why Have A Options Spread Watchlist

A watchlist will not take the place of knowledge or experience. But having a watchlist will perk up my ability to keep track of hundreds of different data points. I can now keep watch over a dozen open Vertical Bull Put Credit Spreads at one glance, plus actively review a dozen other possibilities for new Spreads.
Watchlists layouts are relatively personal. To me, the ones I found on the Internet were kludgy, clunky, and questionably organized. Some were missing information I would think to be essential, and others included data that was not relevant. Most were too spartan – others way too flashy.
Likewise, anyone looking at my watchlist will see it just as bewildering.
If anyone is interested, for a small donation, they can download a strip-down and unsupported version of my Excel Watchlist.
Commentary Contents
Being new to Vertical Options Spreads, anything to help me get organized is greatly appreciated. And with my background in Excel spreadsheets, I was able to devise a watchlist customized to me.
This week’s post will take a close look at how I built my watchlist – an Excel Spreadsheet that pulls live data from my ThinkorSwim trading platform. I use my watchlist for three reasons:
- Keep an active look at currently opened positions.
- Test new strategies or risky positions in a “paper-trade” mode
- Configure and stage prospective Spreads that I am considering and compare these configurations with multiple underlying assets.
ThinkorSwim / Excel
As a prerequisite to this post, I must have Microsoft Excel and TD Ameritrade’s ThinkorSwim (ToS) trading software installed on my PC. The post “Using Excel with ThinkorSwim” will review how to install ThinkorSwim on a laptop and configure it in Microsoft Excel.
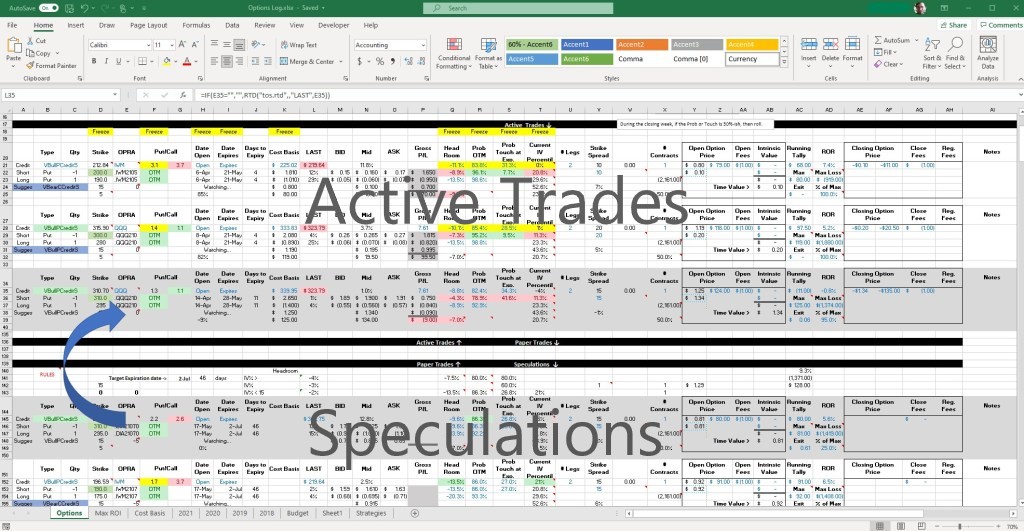
WATCHLIST BIG PICTURE
My watch list consists of 3 major sections. Starting from the bottom, these sections are:
- “Speculations” (Bottom)
- “Paper Trades” (middle)
- “Active Trades” (Top)

Watchlist – Speculation
The Speculation section of my watch list is where I construct possible new Options Spreads. Each proposed Spread consists of a block of six rows. In each of these six-row blocks, I will enter my criteria for my watchlist’s underlying assets based upon how I evaluate this week’s Market Sentiment (see below). These six rows are highlighted in the image above.
Several cells in these blocks will pull live data from ThinkorSwim to allow me to compare probabilities, premiums, headroom, possible max-loss, and many other necessary data points I need to make decisions. The data points from ThinkorSwim are updated every 1-second. This frequency allows me to see patterns and trajectories in near real-time.
The “Speculation” section is the focus of this week’s Journal Entry. I will go into detail on the other two sections in later posts.
Watchlist – Paper Trades
Once I make a selection, I have a choice. If my goal is to watch how my selected spread configuration will perform, I will copy the 6-row block from the Speculation section and then “Insert Copied Cells” these rows into the “Paper Trade” Section. I will do this if I am unsure how a different strategy will perform. Once I do this, I then have to add additional static data to the position block to monitor its progress. (More info on the necessary “static” data in Part 2 of this topic.)
Watchlist – Active Trades
If I intend to open a new position, I would enter the chosen spread configuration in my ThinkorSwim trading platform and wait until the order is accepted. Once accepted, I will also copy the 6-row block from the Speculation section and “Insert Copied Cells” at the bottom of the “Active Trades” section. Again, once I have done this, I would add additional static data to allow me to monitor the position’s progress.
Open position monitoring is the primary function of my watchlist. With live updates from ThinkorSwim, I can quickly see which position is moving in the wrong direction and get suggestions on how to exit if needed. But addressing this section requires starting with the “Speculation” section first. So I’ll wait until a future post to elaborate on monitoring open positions.
Watchlist Speculation Section
The Speculation section of my watchlist is supposed to be a quick and easy way to compare like-configured Vertical Bull Put Credit Spreads using different underlying assets. I’ll enter a couple of generic data points at the top, then watch the different underlying reactions.
Notes about my examples:
- There is a lot of superfluous information throughout my watchlist spreadsheet. I will ignore these for now.
- Many of the cells in my watchlist are used only in the “Active Trades” section and are not relevant in the “Speculation” section. I will ignore these for now.
For brevity, I’m going to divide this section into three subsections:
- Describe the Prospective Spread
- Performance Data For My Prospective Spread
- Dollars and Cents
Describe the Prospective Spread
This section will show how to:
- Calculate a value 1-Standard Deviation below the current value of the underlying asset.
- Calculate a recommendation for a Short Strike that is more than 1-SD below asset value.
- Determine what the Long Strike will be.
- Assemble the OPRA (Options Price Reporting Authority) designators for the long and short strikes puts used in my prospective spread. As shown from the screen-captured images below, the calculated OPRA IDs will be “.DIA210702P320” and “.DIA210702P300”. I can then use these cells in the rest of this block to retrieve performance and price information.

- General input affecting all prospective Spreads:
- G141 = the Expiration date (literal date manually entered). This date value will be used with all the speculative spreads within this section.
- G141: 7/2/2021
- D142 = the Strike Width of these prospective spread positions (literal/manual entered). This will be used with all speculative spreads within this section.
- D142: 20
- G141 = the Expiration date (literal date manually entered). This date value will be used with all the speculative spreads within this section.
- Basic Spread Configuration:
- E145 = the underlying asset I am investigating. This is a literal entry.
- E145: DIA
- B146 & B147 = the Options type based upon the selected strategy (Puts for the Vertical Put Spread). These are literals but could be calculated based on the value of B145.
- B146: Put
- B147: Put
- A146 & A147 identify the row as being the “Short” Strike or “Long” Strike leg of the spread. These are literals but could be calculated based on the value of B145.
- A146: Short
- A147: Long
- C146 & C147 = the number of contracts that I propose. They both need to be numerical the same. C146 is the number of Short Strikes I will be selling (-) and C147 is the number of Long Strikes I will be buying (+).
- C146: -1
- C147: 1
- H146 & H147 = the proposed date to open this spread:
- H146 & H147: =TODAY()
- I146 & I147 = the proposed Expiration Date:
- I146 & I147: =G$141
- J146 & J147 = the number of days to the proposed expiration date:
- J146 & J147: =IF(NOW()>=I146+”15:00:00″,”Expired”,DATEDIF(TODAY(),I146,”d”))
- D145 = one Standard Deviation below the current value of the underlying asset. My Short-Strike must be this value or less.
- D145 =L145-(L145*T147*SQRT(J146/365)) (assuming a put spread). (see post “Entry Rules for a Vertical Bull Put Credit Spread” for details on how to calculate SD.)
- D149 = Strike’s delta difference as shown on the Option Chain (the difference from one Strike to the next). For DIA there is a 5-point difference between Strikes.
- D149: 5
- D146 = the suggested Short Strike based upon my Entry Rules for a Vertical Bull Put Credit Spread. This is a calculated value using the “FLOOR” function of Excel:
- D146: =FLOOR(D145,D149)+E148
- D147 = the suggested Long Strike.
- D147: =D146+D142
- E145 = the underlying asset I am investigating. This is a literal entry.
- Create OPRA Code Name
- E146 = the OPRA code for the calculated Short Strike Put Option:
- E146: =IF(D146=””,””,”.”&E145&TEXT(I146,”YYMMDD”)&LEFT(B146,1)&D146)
- E147 = the OPRA code for the calculated Long Strike Put Option
- E147: =IF(D147=””,””,”.”&E145&TEXT(I147,”YYMMDD”)&LEFT(B147,1)&D147)
- E146 = the OPRA code for the calculated Short Strike Put Option:
I can now use these OPRA IDs with ToS to pull options-specific data for the rest of my subsections.
Performance Data For My Prospective Spread
This subsection will show how to:
- Calculate the Mark Premium Price for the Vertical Spread.
- Display the Probability the Short Strike will expire Out-of-The-Money (OTM).
- Display the Probability the asset value will “touch” the Short Strike.
- Display the percentage the underlying asset have to fall before going ITM with the Short Strike
- Display the Implied Volatility (IV) of the underlying asset.

- Retrieve the Current Asset Price
- L145 = The current price of the Spreads’ underlying asset
- L145: =IF(E145=””,””,RTD(“tos.rtd”,,”LAST”,E145))
- L145 = The current price of the Spreads’ underlying asset
- Get the Spread’s Premium price:
- M146 = the Bid price of the Short-Strike leg. This will be a positive value
- =IF($E146=””,””,RTD(“tos.rtd”,,”BID”,$E146)*IF(C146>0,-1,1))
- M147 = the Bid price of the Long-Strike leg. This will be a negative value.
- M147: =IF($E147=””,””,RTD(“tos.rtd”,,”BID”,$E147)*IF(C147>0,-1,1))
- O146 = the Ask price of the Short-Strike leg. This will be a positive value
- O146: =IF($E146=””,””,RTD(“tos.rtd”,,”ASK”,$E146)*IF(C146>0,-1,1))
- O147 = the Ask price of the Long-Strike leg. This will be a negative value.
- O147: =IF($E147=””,””,RTD(“tos.rtd”,,”ASK”,$E147)*IF(C147>0,-1,1))
- N146 = the Mark price to sell the Short-Strike leg.
- N146: =IF(E146=””,””,(O146-M146)/2+M146)
- N147 = the Mark price to buy the Long-Strike leg.
- =IF(E147=””,””,(O147-M147)/2+M147)
- N148 = the Mark price (the premium I will receive) for the proposed Spread.
- N148: =SUM(N146:N147)
- M146 = the Bid price of the Short-Strike leg. This will be a positive value
- Display Performance Matrix:
- G145 = the current Put/Call Ratio for the underlying asset:
- G145: =RTD(“tos.rtd”, , “PUT_CALL_RATIO”, E145)
- Q146 = Short Strike’s headroom (the percentage the current asset price has to fall before the Short-Strike becomes ITM).
- Q146: =IF(E146=””,””,(D146-L145)/L145)
- Q147 = Long Strike’s headroom (the percentage the current asset price has to fall before the Long-Strike becomes ITM (Max-Loss))
- Q147: =IF(E147=””,””,(D147-L145)/L145)
- R146 = the probability of the Short Strike expiring OTM:
- R146: =IF(E146=””,””,IF(A$145=”Debit”,””,VALUE(RTD(“tos.rtd”,,”PROB_OTM”,E146))))
- R147 = the probability of the Long Strike expiring OTM:
- R147: =IF(E147=””,””,IF(A$145=”Debit”,””,VALUE(RTD(“tos.rtd”,,”PROB_OTM”,E147))))
- S146 = the probability of the Short Strike being touched:
- A146: =IF(E146=””,””,VALUE(RTD(“tos.rtd”,,”PROB_OF_TOUCHING”,E146)))
- T147 = the current Implied Voltility (IV) of the underlying asset
- T147: =IF(E145=””,””,VALUE(RTD(“tos.rtd”,,”IMPL_VOL”,E145)))
- G145 = the current Put/Call Ratio for the underlying asset:
Dollars and Cents
This subsection will show how to:
- Calculate the total premium received for the proposed spread
- Calculate the max-loss (the total dollar amount I need to set aside during the life of this position).
- Display a simple Return on Risk (ROR)

- The Financial data for this Spread:
- Y145 = the per-share premium available for this Spread configuration
- Y145: =SUM(N146:N147)
- Z145 = the total premium I can collect from this Spread configuration
- Z145: =IF(Y145=””,””,(Y145*(X145*100)+AA145))
- AC145 = used primarily in the “Active Trade” section as the exit price changes. I will expand on this cell in the next post.
- AC145: =IF(D146=””,””,IF(AF145<>””,Z145+AF145,Z145))
- AD145 = the Return on Risk for this Spread configuration
- AD145: =IF(AC145=””,””,AC145/ABS(AD147))
- AC147 = the max gain for this Spread configuration
- AC147: =IF(E146=””,””,IF(Y145>0,Y145*X145*100,((V145*100*X145)+AD147+AG145)))
- AD147 = the max loss for this Spread configuration
- AD147: =IF(E146=””,””,IF(Y145>0,-((V145*100*X145)-AC147),Y145*X145*100))
- Y145 = the per-share premium available for this Spread configuration
Conclusion
The six-row blocks that describe a prospective new Vertical Bull Put Credit Spread in the “Speculations” section are identical to the six-row blocks used to monitor open position in the “Active Trades” section. But while speculating new Spreads, many of these cells will be either tangential or flat-out superfluous. These apparent extraneous cells are placeholders (stubs) that will only have relevant information while monitoring open positions. Once I copy this six-row Speculation block to the Active section, I will update these cells.
Next Step
A detailed look at the Active Trade section will be found in the “Custom Options Watchlist using Thinkorswim in Excel – PT 2” post.
WAS THIS POST HELPFUL?
ALTHOUGH BLOGGING IS GREAT FUN, ANY DONATION WILL LET ME KNOW IF I AM ACTUALLY HELPING SOMEONE ELSE.
(PLUS, IT HELPS PAY TO KEEP MY WEBSITE ACTIVE 😊)
Choose an amount
Or enter a custom amount
Your contribution is appreciated.
Donate
Other Posts from OptionsTradesByDamocles
This Week’s Market Sentiment
This Market Sentiment Section is typically completed by midday Monday morning. By the time this journal is published, it will be a week old.
(As of 05/16/2021)
In this section, I review five indicators: VIX, Put/Call Ratio, S&P 500, Consumer Sentiment Index, and Geopolitical events that could affect the market’s direction. I will use these indicators to help guide my trading decisions for this week.
Geopolitical Tree-Shakers (GTS):
GTS is like a lit fuse to a bomb. The fuse can be fast or slow, and the bomb can easily be a dud. But I need to watch this closely as an indicator. The GTS can significantly disrupt all the other indicators at the drop of a hat.
- Rising interest/inflation rates will be a continued background pressure for some time
- Gas shortages at stations
- Israeli/Palestinian conflict continues – whatever happened to the Abraham Accord under Biden?
- States are ending federal unemployment benefits early
- Mega retailers, like Walmart and Home Depot, will be releasing their earnings this week
- National Association of Home Builders sentiment index to be released Monday morning, housing starts on Tuesday, and existing home sales on Friday
- CDC revises mask recommendations
The April U.S. Employment Report threw the markets in turmoil early last week that the late-week rally could not reverse. There is a lot of spooky things (like the threat of inflation) still haunting the Marketeers.
The Colonial Pipeline resumes its normal operations, but the panic buying of gas has left many gas stations empty. That will take a little while to unwind.
The CDC published a revised recommendation for masks late last week. The relaxing of wearing masks is going to boost consumer sentiment over the next few weeks.
There is a real lack of bad GTS events this week, and there is a real lack of good GTS news as well. But the CDC masks news last week and the vaccination rate of the US is a good indicator that the worst of 2020 is over. This week’s DEFCON (Damocles Options Trading Readiness Signal) will be initially set at 4 (although a high 4).
(Note: I’m tempted to set this to a level 5 just on GTS, but the politically exacerbated racial angst, continued partisanship across the country, and a large number of Democratic states still demanding lockdown control is keeping the financial temperature of the nation from being peachy.)
Setting DEFCON to 4
VIX: Broad Market Volatility
The VIX is an emotion-gauge for the general investing population. It is thought to be driven by the Marketeers’ current level of greed or fear. As a one-month forward-looking volatility matrix, it is not designed to tell us which direction the market will be going, but more of how fast it can get there.
A VIX of 15% is assumed to be a market at rest. But since the intrinsic nature of the Stock Market is to move up, the markets with a VIX closer to 15% or below will have an innate tendency to rise.

The 1-month Regression Channel for the VIX exploded in width over last week’s panic selloff. But the quick recovery late last week seemed to show that the shoe we were expecting to drop the week before did so. But there still appears to be a dreariness from the Marketeers that a trajectory correction is about to happen.
The US Employment Report last week was way below expectation. On top of that, the Colonial Pipeline hacked through a large portion of the Marketeers into a panic. But once the CDC came out with their well-timed no-mask recommendation the markets took a collective breath.
The VIX ended last week at 18.1%, higher than the week before at 16.7%. But his hike overshadows that pop to 27.5 last Wednesday.
Market jitters continue to rise for the near term as the Marketeers continue to digest the first true Biden economic numbers.
Due to the change of VIX trajectory, I am downgrading the DEFCON to 3. Let see if the following indicators will change that level.
Downgraded DEFCON = 3
Put/Call Ratio:
Put Options are frequently used as protections against existing investments falling. When the ratio between Put Options bought versus Call Options bought is above 1, then this is an indicator that the Marketeers are buying insurance to what they may see as declining Markets. Conversely, when the Put/Call Ratio falls below 1, then there is a general sense that the broader Markets will increase, and more investors are buying more than selling.

The ratio popping to near .7 on Wednesday of last week supports the jump in the VIX. There was a slight recovery, but the end of week Put/Call Ratio shows rising concern.
The 9-Day SMA is above the 50-Day SMA and above the .5 line. So the short-term trend is moving more to the jitters side. The 50-Day SMA is steadily rising and is above the .5 line. All this suggests the Marketeers are more interested in buying Puts – believing lowering stock prices.
(Even though the P/C Ratio over the past month averaged above the .5 line, it is still far below the “Head for the Hills” 1.0 line.)
The steady rise in the 50-Day SMA signals rising jitters. So far, the GTS, VIX, and this P/C Ratio appear to be a response to worse-than-expected economic news. But that “worse news” may be behind us. But there is nothing here to suggest raising the DEFCON level.
Maintaining DEFCON = 3
Consumer Sentiment Index (CSI):
I’m searching for a new Consumer Sentiment Index (CSI) chart as provided by the University of Michigan.
A low CSI index is a general dissatisfaction with our current management of U.S. economic policies. This dissatisfaction will imply that something has to change. A high satisfaction rating suggests approval of the current policy management and implies market stability.
The preliminary May index shows the CSI falling to 82.8 from April’s final of 88.3. This is not good news for the Biden Economic Policies. Rising Inflation is signaling higher prices, and the rising unemployment (low employment) suggests that supply shortages may continue (creating a feedback loop of higher prices for demand products).
This fall in CSI added to the jittery VIX and P/C Ratio, Nothing here suggests raising the DEFCON level.
Maintaining DEFCON = 3
Market Indexes:
DOW (DJX) = 34,382 – down 1.1% from 34,778 last week. (4 week deviation: 292 up from 262 last week)
S&P 500 (SPX) = 4,174 – down 1.4% from 4,233 last week. (4 week deviation: 35.4 up from 28.6 week)
The S&P 500 is a stock market index that tracks the 500 largest companies in the U.S. This index represents about 80% of all the capitalization for the country. The S&P is widely considered the best indicator of how all the U.S. markets are performing.

Market Thrashing
4-Week Thrashing of DJX = +/- 292 points or 0.8% of the market’s volume is flat from 0.8% last week.
4-Week Thrashing of SPX = +/- 35.40 points or 0.8% of the market’s volume is flat from 0.7% last week.
The Indexes thrashing below 1.x% is indicating a steady-hand market. And since the S&P 500 and DOW’s trend trajectory is bullish, there is no reason to believe that will change.
Even with the market adjustment during the first half of last week, the Trend Channel has not changed for the past four months. With thrashing and trajectory about the same, the adjustment may simply be a blip. But the general (straight line) trajectory for the markets over the past 30-ish days has been mostly sideways. This could be a signal of an overall weakening.
Of those assets that are in my watchlist, QQQ and IWM show the 9-Day SMA below the 50-Day. These two and the others in the list have the current price falling below the 9-Day SMA. All of the assets show the Trend-Channel rotating Bearish. None of this shows promise for the short-term bull.
Even though the GTS, VIX, and P/C Ratio show rising market jitters, the Marketeers continue to see a barely improving economy – but that may be short-lived. I will maintain the DEFCON level at 3 but keep my eyes open for early opportunities.
Maintain DEFCON = 3
My sentiment for this coming week:
Of the five indicators:
- the GTS lists an abnormal lack of crisis – YEAH
- the VIX continues to exhibit rising concern by the Marketeers – BOO
- the P/C Ratio shows that a growing number of Marketeers are continuing to bet on a market pull-back – BOO
- the CSI screams a falling sentiment of the current economy – BOO
- the Market Movement continues to stay bullish but at a slowing pace – Neutral
I feel the markets have a higher potential to move mostly sideways over the next could of weeks.
Trading Readiness Level for this week
This week, I will focus on:
- One spread late in the week (totaling < $2.5K risk) as the Markets see fit
- If the housing numbers on Monday are positive and the markets are moving bullish, I may change this to two spreads.
- Spread term of 8-weeks or less
- Probability of OTM > 83%
Profit and Loss Statement
(As of 05/21/2021)
Balance Sheet
| Year 2021 | Month May | Week #20 | |
|---|---|---|---|
| Beginning Account Balance | $16,000.00 | $17,453.03 | $17,789.95 |
| Deposits (Div. & Int.) | $0.50 | $0.00 | $0.00 |
| Withdraws (paycheck) | -$1,200.00 | -$0.00 | -$0.00 |
| Premiums on Open | $3,44201 | $514.00 | $164.00 |
| Premiums on Close | -$242.00 | -$9.00 | -$0.00 |
| Fees Paid (total) | -$48.60 | -$6.12 | -$2.04 |
| Ending Account Balance | $17,951.91 | $17,951.91 | $17,951.91 |
| Total Gain/Loss | $1,951.91 | $498.88 | $161.96 |
| ROR | 2.9% | 0.9% | |
| ROC | 12.2% |
Progress Graph

(Note: the negative weekly results for weeks 4, 8, 12 and 17 are when I withdrew $300 from the Trading Account for my paycheck.)
My Performance vs. SPY
Hypothetically, instead of depositing $16,000 in my Options Trading Account, could I have done better if I bought $16,000 of the ETF/SPY instead?
| Options Trading | SPY (Fictional) | |
|---|---|---|
| Initial Investment (As of Jan 4, 2021) | $16,000 (Cash) | $16,000 (43.39 shares @ $368.55) |
| Funds Added | $3,442.51 (Premiums) | 0.31 shares (Dividends Reinvested) |
| Funds Removed | -$290.60 (Early Close & Fees) | $0 (Fractional Shares Sold) |
| Ending Balance | $19,151.91 (Cash) | $18,226.33 (43.70 shares * $417.13 CV) |
| ROI | +19.7% | +13.9% |
Schedule for this Week
Goals for this week: (05/17/2021 – 05/21/2021) (Week #19)
- Document lessons learned or new thoughts
- Open one or two wide-strike spread
- Update Trading Log as trades occurs
Monday:
- Determine/update this week’s market sentiment section
- Calculate/record Put/Call Ratios for all stocks on the watch list
- Review/tweak Trend-Channels for all stocks in the watch list
- Set target expiration dates for all options as follows:
- Bull Credit Spreads: Jul 9 (6-8 weeks)
Note: If there are no Options Chains published for the 8-week expiration, then use the next Options Chain down from 8-weeks (7-weeks, 6-weeks). Beyond 4-week expirations, only the monthly chains are available to trade.
- Bull Credit Spreads: Jul 9 (6-8 weeks)
- Look up Ex-Dividend dates for positions in/approaching ITM (MarketWatch/Calendar)
- Stage possible trades for all watch list stocks by 10:00 AM
- NO TRADING BEFORE 10 AM. (Let the Market find its direction after the weekend.)
- Watch one Webcast or take one online mini-course to be completed by Friday.
Tuesday – Thursday:
- Review how yesterday’s staged trades moved. Adjust premiums to take advantage of movements.
- Submit a couple of Spreads, but keep a close watch. If one is accepted, cancel the others (we want only one new active trade per day).
- Be mindful of Entry Rules.
Friday:
- Review the total technical dollars at risk for this week. If significantly below $500, then submit additional spreads if prudent.
- Update and post weekly journal (this blog) with any lessons learned or strategy changes.
This Week’s Trade Activity
(As of 05/14/2021)
Spread Count Summary:
| Year 2021 | Month May | Week #20 | |
|---|---|---|---|
| Vertical Bull Put Credit Spread | 33 | 5 | 2 |
| Vertical Bear Call Credit Spread | 0 | 0 | 0 |
| Vertical Bull Put Debit Spread | 0 | 0 | 0 |
| Vertical Bull Call Debit Spread | 0 | 0 | 0 |
| Margin Interest | 1 | 0 | 0 |
| Total | 34 | 5 | 2 |
Current Dollars at Risk:
| Year 2021 | Month May | Week #20 | |
|---|---|---|---|
| Vertical Bull Put Credit Spread | $13,374. | $6,486. | $2,336. |
| Vertical Bear Call Credit Spread | $0. | $0. | $0. |
| Vertical Bull Put Debit Spread | $0. | $0. | $0. |
| Vertical Bull Call Debit Spread | $0. | $0. | $0. |
| Iron Condor | $0. | $0. | $0. |
| Total Dollar Risk | $13,374. | $6,486. | $2,336. |
| Max Risk Allowed | $16,000.00 | $8,000 | $2,500. |
New Positions Opened This Week
(05/17/2021 – 05/21/2021)
DIA: 315p/305pp – Open 05/21/21 – Expires 07/02/21 – Max Gain = $60.00 – Open Price = $343.45
(Vertical Bull Put Credit Spread)
At Open: Prob. OTM=85.7%, Head Room=-8.3%, Max Loss=$940.00, ROC 6.3%, 42d Dev = $2.86

Entry Rules for Vertical Bull Put Credit Spreads:
- Current maximum dollars at risk < $16,000? Yes ($13,374)
- Max dollar at risk this week < $2,500? Yes ($2,336)
- Max time to have any dollars at risk < 8 weeks (<56 days)? Yes (42 days)
- Long-term trend (four months) bullish? Yes (see chart)
- Short-term trajectory of the underlying bullish? No (see chart)
- Put/Call Ratio < 1, (or falling if it is > 1)? Yes (0.8 down from 1.2)
- Current price above 9-Day SMA?: Yes (see chart)
- 9-Day SMA above 50-Day SMA?: Yes (see chart)
- Short-strike < 1 SD below the current price? Yes (1SD=322.19)
- Short-strikes Prob-OTM > 83%? Yes (85.7%)
- Short-Strike price below the trend channel at expiration?: Yes (see chart)
- Current price within the bottom 1/2 of Trend Channel?: Yes (see chart)
- Long-strike at maximum width (>= 10)? Yes (10 strike width)
Set a GTC Conditional Trailing Stop Limit (CTSL): (Not Set)
QQQ: 295p/280pp – Open 05/21/21 – Expires 07/02/21 – Max Gain = $104.00 – Open Price = $329.59
(Vertical Bull Put Credit Spread)
At Open: Prob. OTM=84.8%, Head Room=-10.4%, Max Loss=$1,396.00, ROC 7.4%, 42d Dev = $7.19

Entry Rules for Vertical Bull Put Credit Spreads:
- Current maximum dollars at risk < $16,000? Yes ($13,374)
- Max dollar at risk this week < $2,500? Yes ($2,336)
- Max time to have any dollars at risk < 8 weeks (<56 days)? Yes (42 days)
- Long-term trend (four months) bullish? Yes (see chart)
- Short-term trajectory of the underlying bullish? Yes (see chart)
- Put/Call Ratio < 1, (or falling if it is > 1)? No (1.2 up from 0.9)
- Current price above 9-Day SMA?: Yes (see chart)
- 9-Day SMA above 50-Day SMA?: No (see chart)
- Short-strike < 1 SD below the current price? Yes (1SD=299.79)
- Short-strikes Prob-OTM > 83%? Yes (84.8%)
- Short-Strike price below the trend channel at expiration?: Yes (see chart)
- Current price within the bottom 1/2 of Trend Channel?: Yes (see chart)
- Long-strike at maximum width (>= 10)? Yes (15 strike width)
Set a GTC Conditional Trailing Stop Limit (CTSL): (Not Set)
Trades Currently Cooking
(As of 05/21/2021)
SPY: 365p/345p – Open 05/13/21 – Expires 06/30/21 – Max Gain = $138.00 – Open Price = $408.94
(Vertical Bull Put Credit Spread)
At Open: Prob. OTM=83.2%, Head Room=-10.6%, Max Loss=$1,862.00, ROC 7.4%, 48d Dev = $8.18
DIA: 325p/315p – Open 05/07/21 – Expires 06/18/21 – Max Gain = $81.00- Open Price = $347.06
(Vertical Bull Put Credit Spread)
At Open: Prob. OTM=83.3%, Head Room=-6.4%, Max Loss=$919.00, ROC 8.7%, 42d Dev = $4.23
QQQ: 297p/282p – Open 05/05/21 – Expires 06/18/21 – Max Gain = $131.00- Open Price = $329.06
(Vertical Bull Put Credit Spread)
At Open: Prob. OTM=82.7%, Head Room=-9.8%, Max Loss=$1,369.00, ROC 9.5%, 44d Dev = $9.88
IWM: 205p/195p – Open 04/29/21 – Expires 06/04/21 – Max Gain = $70.00- Open Price = $227.79
(Vertical Bull Put Credit Spread)
At Open: Prob. OTM=84.8%, Head Room=-9.9%, Max Loss=$930.00, ROC 7.4%, 36d Dev = $4.11
IWM: 205p/190p – Open 04/28/21 – Expires 06/18/21 – Max Gain = $134.00- Open Price = $228.03
(Vertical Bull Put Credit Spread)
At Open: Prob. OTM=80.9%, Head Room=-10.2%, Max Loss=$1,366.00, ROC 9.7%, 51d Dev = $5.12
DIA: 320p/310p – Open 04/21/21 – Expires 05/28/21 – Max Gain = $75.00- Open Price = $340.69
(Vertical Bull Put Credit Spread)
At Open: Prob. OTM=84.1%, Head Room=-6.1%, Max Loss=$925.00, ROC 8.0%, 36d Dev = $5.40
SPY: 390p/375p – Open 04/21/21 – Expires 05/28/21 – Max Gain = $107.00- Open Price = $415.85
(Vertical Bull Put Credit Spread)
At Open: Prob. OTM=82.3%, Head Room=-6.2%, Max Loss=$1,393.00, ROC 7.6%, 37d Dev = $9.65
IWM: 205p/195p – Open 04/16/21 – Expires 05/28/21 – Max Gain = $100.00- Open Price = $244.17
(Vertical Bull Put Credit Spread)
At Open: Prob. OTM=80.3%, Head Room=-8.5%, Max Loss=$900.00, ROC 11.0%, 42d Dev = $5.42
QQQ: 310p/295p – Open 04/14/21 – Expires 05/28/21 – Max Gain = $125.00- Open Price = $339.95
(Vertical Bull Put Credit Spread)
At Open: Prob. OTM=82.4%, Head Room=-8.8%, Max Loss=$1,374.00, ROC 9.0%, 44d Dev = $10.35
Trades Closed This Week
(As of 05/21/2021)
QQQ: 300p/280p – Open 04/08/21 – Expires 05/21/21 – Max Gain = $119.00- Open Price = $333.83
(Vertical Bull Put Credit Spread)
At Open: Prob. OTM=85.4%, Head Room=-10.1%, Max Loss=$1,879.00, ROC 6.3%, 43d Dev = $7.80
At Close: Prob. OTM=95.5%, Head Room=-8.1%, IV%=29.4%, ROR= 6.3%
IWM: 200p/190p – Open 04/06/21 – Expires 05/21/21 – Max Gain = $80.00- Open Price = $225.02
(Vertical Bull Put Credit Spread)
At Open: Prob. OTM=83.8%, Head Room=-11.1%, Max Loss=$919.00, ROC 8.6%, 45d Dev = $5.80
At Close: Prob. OTM=96.0%, Head Room=-9.5%, IV%=15.2%, ROR= 8.7%
Conclusion
Disclaimer
Even though I have tried to make it clear that this blog is my journal, documenting my trek into Options Trading, it has been suggested by others that I, nevertheless, include a general disclaimer. So here goes…
“This blog and the information contained herein is not intended to be a source of advice or analysis concerning the material presented. The information and/or documents contained in the blog do not constitute investment advice.”


3 THOUGHTS ON “Custom Options Watchlist using Thinkorswim in Excel – PT 1”