
Accept your past without regrets.
(unknown)
Handle your present with conviction.
Face your future without fear.
Prologue
As the maiden voyage of this report, there is a lot of history that is NOT being explained. I’m beginning as if this is just another week. But I will touch on many lessons already learned as I continue to organize my thoughts and post.
One tidbit of history is Trump’s Tweets about the US/China snafu starting the middle of April that lasted for about six weeks and sucked most of my YTD profits – but I still Luv ya Donald! So my first P&L report below is dismal!
This week, I’m also rethinking ways to measure my trading performance in a more meaningful way. Dollars up or dollars down shows real ramifications to my portfolio, but it does not provide any matrix that I can use to predict the future. I’m considering a monthly Return on Capital (ROC) as a percentage, that should be better. Once I get my spreadsheet set up to measure this as another matrix, I will set a monthly ROC goal.
Also this week, I am reviewing a new trade strategy – Bull Debit Vertical Spreads. And I am reevaluating my Risk-Management exit strategies.
P&L and Performance Status
YTD: $744.79
Last Month:
- Started 11 trades (6 Put Spreads and 5 Cover Calls).
- 9 trades have completed, 2 still cooking.
- Of the 9 completed trades, winners= 6, losers =3 (re: above snafu).
- Current last month’s net profit = -$524.11 (67% win rate).
MTD: $247.35
- Started 6 trades. 4 are cover calls and 2 are spreads. Of the 6, 3 are still cooking.
Trades Ending 6/7/19:


AMD 32.5cc – Expired 6/7 – Worthless – Net Premium Collected = $57.55
CRM 165cc – Expired 6/7 – Worthless – Net Premium Collected = $22.55
CRM 162.5cc – Expired 6/7 – Worthless – Net Premium Collected = $22.55
ETF:QQQ 176p/175p – Expired 6/7 – Worthless – Net Premium Collected = $34.05
I thought this was a goner. QQQ’s price dropped down to $170 at the start of the final week of the trade. Only an incredible +1,000 DOW point rise saved this. I made the trade on May 17, after a week of rebounding. Maybe this big bounce is a signal that the bottom has been reached.
MA 255cc – Expired 6/7 – ITM – Net Premium Loss = $-.40
As the image below shows, MA rocketed by $12 within the 4 days of this trade. This trade closed ITM so my account was deducted $1,080 plus 20.95 for assignment fee. But I’m interpreting the $12 jump as exuberance and will predict a relatively quick (inside 30 days) pull back as other investors take profit. Therefore I immediately submitted a repurchase of MA at a limit price of $254.50. Even though the trade is over… it is not over until it is over…
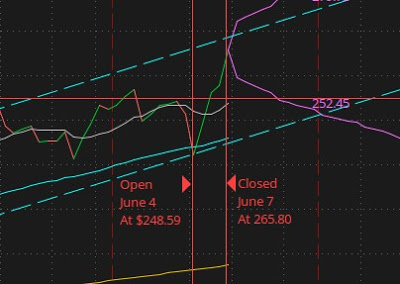
One matrix that I think I missed on this trade was the IV was relatively high and the term of the trade was short. That volatility suggested that MA was primed to make a big jump, one way or the other. And since the price when I opened the trade was at the bottom of the trend channel, I should have guess that the price was more likely to bounce big up. – Oh Amazing Kreskin,
Trades Still Cooking
ETF:IWM 144p/143p/expire=6/14 (this Friday)
Currently, the probability of OTM = 98% so I feel the $43.05 premium collected is pretty safe.
ETF:XLV 86.5p/85.5p/expire 6/21
Current probability of OTM = 93%. I’m over a week out from expiration but the trend currently going my way. Not holding my breath.
New Trades for this week
UNH 250c/expiry=6/21 (11 days)/credit = $106.00-$6.95=$99.05
United HealthGroup Inc. (UNH) is paying $1.08 per share dividends to holders of their stock on June 14. I have no desire to buy and hold UNH or any healthcare related instruments until after the 2020 election – since healthcare in general and healthcare insurers in particular will be a prime political target. But the short notice on the expanded dividend payout suggests an opportunity.
With the assignment of MA, I have enough free cash to purchase 100 shares of UNH for $246.61 today (June 10), which I did. I then immediately sold a cover-call for UNH at a strike price of $250 expiring Jun 21 for $190. Since I have no desire to hold UNH, I am perfectly happy to get rid of it for a $339 profit no mater what the actual price will be at expiration (assuming the stock price goes up).
So this trade should yield $108 dividend + $190 option premium + $339 stock return on assignment – $9.90 total fees paid to Ameritrade = $627.1 for a 2 week trade deal. This is 2.5% return on standing cash or 65% ROC annualized. Once completed on June 21, I’ll reset the limit-buy order for MA as before.
The only risk is that UNH tanks for a long period of time – which I feel is not too likely. But if it does, I will keep selling weekly cover calls until it sells at $250.
ETF:DIA 264c/262.5c/expiry=7/5 (24 days)/debit= $74 -$5.95 = -$79.95.
Bull Call Debit Spread is a new strategy for me. To date, I’ve been focusing primarily on Bull Put Credit Spreads and Iron Condors because they are the easiest to find and put together.
At the time I opened this trade, DIA was trading at 261.78.
The trend analysis for DIA has the 9-day SMA breaching the downward trend channel. Even though the 9-Day has not move up above the 50-day I’m guessing that this is a sign of a turnaround. I may regret this later…

ETF:DIA 251p/246p/expiry=7/5 (22 days)/credit=106.00-$6.95 = 99.05
Bull Put Credit Spread with a 5 strike width instead of the usual 1. With a strike width of 1, I can engineer my ultimate max loss amount to a max of -$250. This is almost a set and forget configuration. But with a strike width of 5 or bigger, the max loss is much higher – but yet the premiums received where equally much higher. I’ll make sure the trade configuration is does not have a max loss greater of $1,000, but now I have to be more proactive with my Risk Management. When the current premium for this trade is 2 times what I received then I need to exit the trade. The downside of this trade configuration will be big drops in the market.
Rules of the Week
Trade the Trend: Understand the direction of the underlining stock. If you are trading monthly’s (an option trade with a life span of 3 to 4 weeks) then go back 12 weeks and chart which direction it is moving. In the case below of ETF:DIA the 6-week trend is moving down and the ETF price has been bouncing up and down within that declining trend channel. Additionally, the 9-day SMA is below the 50-day SMA. So as this point I suggest to not placing any bull spreads when the general trend is bearish.

But be on the lookout when the price breaks out of a trend channel. This could be sign of a trend reversal.
Epilogue
One of my most important rules to option trading is to never bet more than I am willing to loose. My current risk level is $250 per trade and I will not have more than $1,000 at risk at one time. If the market turns downward, then I will back off from my weekly trade schedule. If the market continues to trudge higher, then I will continue with my trading schedule.
The problem with my most important rule is that I have a hard time managing losing trades. When the market drifts up there is nothing for me to do, so I do nothing. When it slowly drifts down I tend to believe that it will move back up, so I do nothing. And when the market jumps out of a window and goes crashing down and falls through my long position then I’m already at max loss, so I do nothing. I need a much better way to manage losing trades than I do now (which is going nothing).
Cheers…


No comments! Be the first commenter?