

In this week’s entry, I will explain how I developed my “Killer Watchlist” – a custom Excel/ThinkorSwim spreadsheet I use to select and monitor multiple Vertical Options Spreads at a glance.
Hold onto your lugnuts!
– Stanly Ibkiss as the Mask (Movie: The Mask)
It’s tiiiiime for an overhaul!!!
Custom Options Watchlist using thinkorswim & Excel

Whether I have a “Killer Watchlist” or one that is just merely jaw-dropping is totally up to… me. This is why making my own custom Options Spreads Watchlist using ThinkorSwim in Excel is ideal.
This week’s entry will explain how I constructed the “Active Trades” section of my “Killer” Excel/ThinkorSwim watchlist. I will also point to seven critical ToS data elements that I use to monitor multiple working Vertical Spread positions at a glance.
If anyone is interested, for a small donation, they can download a strip-down and unsupported version of my Excel spreadsheet Watchlist.
About My Watchlist

Monitoring my open Vertical Spreads requires me to track the position’s stance, trajectory, and velocity. To do this, I need to organize my watchlist to see all relevant data in one glance. Finally, those critical elements that monitor stance, trajectory, and velocity need to be color-coded. So in my custom watchlist, I make liberal use of Excel’s “Conditional Formatting/Highlight Cells Rules.”
To effectively monitor my open positions, I need to do the following:
- Fill in the blanks in the Speculation section of my watchlist – for each Spread Matrix. This will help me pick a winnable Spread.
- Open a new Vertical Spread position using my ThinkorSwim trading platform.
- Once a new order has been executed, copy and insert the Spread’s Matrix (the six rows that define the Vertical Spread I just opened) from the Speculation to the Active Trades section.
- Update the few cells to capture opening data
- Watch of red cells.
Last week’s Journal Entry, “Custom Options Watchlist using ThinkorSwim in Excel Pt 1“, covered points 1, 2, and 3. In that post, I dissected much of the “Speculation” section and documented most of the ToS/Excel equations used to find prospective spreads. This week, I will show in detail only points 4 and 5.
the three sections of my Watchlist
Top Section
Active Trades
Middle Section
Paper Trades
Bottom Section
Speculation (staging)

Recording a New Spread Position
Once my ThinkorSwim Trading Platform confirms it has opened a new position, I will do the following tasks:
- Insert the newly opened Spread Matrix at the bottom of the “Active Trade” section
- Row-select and Control-C copy the Spread Matrix (the six-row block) in the Speculation section that details the new position.
- Selecting the first available line at the bottom of the “Active Trades” section, right-click and “Insert Copied Cells.” This will paste a copy of the new Spread Matrix at the bottom of the “Active Trades” section (see image above).
Set the Spread Starting Values
Dates and Strike values are set in the Speculation section using reference variables and will change often. But once the staged Spread is copied in the Active Trades section, these cells need to be fixed (made literal) so OPRA’s Option designations will not change over the life of the position.

- Make static Date and Strike cells
- D22 & D23 = Select, Ctlr-C copy and “Value Paste” the Short and Long Strikes (cells D22 & D23).
- D22: 310
- If Short-Strike (D22) is lower than 1SD (D21), then highlight cell Green. Otherwise, highlight Red.
- D23: 295
- If Long-Strike (D23) is lower than 1SD (D21), then highlight cell Green. Otherwise, highlight Red.
- D22: 310
- H22 & I22 = Select, Ctrl-C copy, and “Value Paste” the open and expiration dates
- H22 = 04/14/2021
- I22 = 05/28/2021
- D22 & D23 = Select, Ctlr-C copy and “Value Paste” the Short and Long Strikes (cells D22 & D23).
PERFORMANCE DATA FOR MY PROSPECTIVE SPREAD
- Copy Put/Call Ratio for future comparison (referencing the previous image)
- F21 = Select, Ctrl-C copy, and “Value Paste” the current Put/Call Ratio from G21
- F21: 1.3
- If the current P/C Rato (G21) is lower than Opening P/C Ratio (F21), highlight G21 Green. Otherwise, highlight Red.
- F21: 1.3
- F21 = Select, Ctrl-C copy, and “Value Paste” the current Put/Call Ratio from G21
- Set current state for each leg
- F22 = is the Short Strike leg ITM or OUT?
- F22: =IF(D22=””,””,IF(L21
- If “OTM” then highlight F22 Green. Otherwise, highlight Red.
- F22: =IF(D22=””,””,IF(L21
- F22 = is the Short Strike leg ITM or OUT?
- F23 = is the Long Strike leg ITM or OUT?
- F23: =IF(D23=””,””,IF(L21
- If “OTM” then highlight F22 Green. Otherwise, highlight Red.
- F23: =IF(D23=””,””,IF(L21

- Record Cost Basis
- K21= Enter the price of the underlying asset at the time the Spread was opened
- K21: $339.95
- If the current asset price (L21) is higher than K21, then highlight L21 Green. Otherwise, highlight Red.
- K21: $339.95
- K22 & K23 = Enter the premium price for each leg (get from the “Filled Orders” section of ThinkorSwim).
- K22: 2.65
- K23: -1.40
- K24 = Premium price for spread
- K24: =IF(K21=””,””,SUM(K22:K23))
- K25 = Total Premium collected from Spread
- K25: =IF(K24=””,””,K24*100*X21)
- K21= Enter the price of the underlying asset at the time the Spread was opened
Note: these status cells directly reference the cells below them (i.e., Q21: = Q22) while in the Speculation section. So while in the Speculation section Q21 & Q22 will show identical values. But once this Spread is inserted into the Active Trade section, I want to fix these values to see how the Spread changes over time.
- Make static Headroom, Prob-OTM, Prob-Touch, and IV Percentile cells
- Q21 = Select, Ctlr-C copy and “Value Paste” Headroom
- Q21: -8.8%
- If the current Headroom (Q22) is lower than Q21, then highlight F22 Green. Otherwise, highlight Red.
- Q21: -8.8%
- R21 = Select, Ctlr-C copy and “Value Paste” Probability of OTM
- R21: 82.4%
- If the current Prob-OTM (R22) is higher than R21, then highlight R22 Green. Otherwise, highlight Red.
- R21: 82.4%
- S21 = Select, Ctlr-C copy and “Value Paste” Probability of Touch
- S21: 34.3%
- If the current Prob-Touch (S22) is higher than S21, then highlight S22 Green. Otherwise, highlight Red.
- S21: 34.3%
- T21 = Select, Ctlr-C copy and “Value Paste” current IV Percentile
- T21: -4%
- Q21 = Select, Ctlr-C copy and “Value Paste” Headroom
Dollars and Sense

- Fix the opening costs
- Y21 = the premium cost basis after the Spread is opened
- Y21: =K24
- Y22 = the current premium cost.
- Y22: =N24
- Y21 = the premium cost basis after the Spread is opened
- Calculate the closing costs
- AE21= the current Mark price of the Spread. This will be negative since I would have to buy at this price if I wish to close early.
- AE21: =-N24
- AF21 = the total cost to me if I close early
- AF21: =IF(AE21=””,””,AE21*(X21*100)+AG21+AH21)
- AE21= the current Mark price of the Spread. This will be negative since I would have to buy at this price if I wish to close early.
- Estimate Exit Price for setting Early Closing Trade Triggers
- AD25 = target the percent of max-gain that I am willing to close early for (see EXIT RULES: VERTICAL CREDIT SPREADS – PT 2)
- AD25: 95%
- AC25 = Exit Price used with ThinkorSwin’s Trade Trigger
- AC25: =(AC23-(AC23*AD25))/100
- AD25 = target the percent of max-gain that I am willing to close early for (see EXIT RULES: VERTICAL CREDIT SPREADS – PT 2)
Monitoring Open Positions
Monitoring my open Spreads is as simple as watching for red…
One Standard Deviation
My Entry Rules state that the Short-Strike (cell D22) must be more than one Standard Deviation (cell D21) below the underlying asset’s current price. How far below 1SD the Short-Strike will depend on the DEFCON level that I will set for the week.
If the Short-Strike rises above 1SD, then D22 will turn red. This is an indication that the position is moving in the wrong direction, and I need to keep a close eye on this position.
Put/Call Ratio
A Put/Call Ratio that is rising implies the Marketeers are buying more Put than Calls. And a rising P/C Ratio can signal a rising level of fear for the underlying. If the current P/C Ratio (G21) rises above the ratio as recorded at open (F21), then G21 will highlight red.
Slightly rising ratios vs. slightly falling ratios are the ebb and flow for the underlying asset. What I’m looking for is a big jump one way or another. If the P/C Ratio rises significantly as the position approaches expiration and stays high, I may want to consider an early exit.
In/Out of the Money
If the current value of the underlying asset falls below the Short-Strike, the status cell F22 will show a red ITM. This will indicate that my position is losing. How much money I will lose will depend on how far below the Short-Strike the underlying asset ascends. At this point, I need to review my Journal Entry “Managing Losing Trades.”
If the current value of the underlying falls below the Long-Strike, the status cell F23 will show a red ITM. This will indicate a total kill for my position.
Note: all other indicators listed in the section would have flashed red before any leg goes ITM.
Last vs Cost
Cell L21 will have the most up-to-date value of the underlying asset. If the “Last” value of the asset falls below the position’s asset cost basis, then the asset is moving in the wrong direction. This should trigger the Conditional Formatting/Highlight Cells Rules to highlight this cell red.
Having the Last value for the underlying fall below the opening price is not bad. But it is a flag that this position needs to be watched.
HeadRoom
It stands to reason if the last price falls below the cost basis, then the headroom between the current asset price and the Short Strike will get narrower. If the headroom becomes smaller than what was recorded when the position opened, this cell (Q22) will highlight red.
If it is getting closer to expiration, I would want the headroom to be wide enough to absorb any asset’s thrashing. If the current Thrashing is large and my headroom is small, I may want to exit early.

Prob-OTM
This matrix element is the one I rely on the most. If the current Prob-OTM falls below the probability at open, then the position moves in the wrong direction, and the cell R22 will turn red. But since calculating this value includes IV, the underlying volatility can fall substantially as it approaches expiration and can boost the probability – even though other elements are showing poorly.
Prob-Touch
I look at this matrix element as mostly informational. As I watch this value, if the probability of touching the Short-Strike rises, then the trajectory of the underlying’s asset price is moving in the wrong direction. If the expiration is near and this value gets close to or over 50%, then I may want to consider an early exit.
Conclusion
I’ve been cobbling my custom watchlist over the past three years. As anyone can observe, there are several other extraneous elements within the Spread Matrix. Many of these elements are tangential information that is interesting to see but does not have an effect on my analysis. I have ignored these in this journal entry.
WAS THIS POST HELPFUL?
ALTHOUGH BLOGGING IS GREAT FUN, ANY DONATION WILL LET ME KNOW IF I AM ACTUALLY HELPING SOMEONE ELSE.
(PLUS, IT HELPS PAY TO KEEP MY WEBSITE ACTIVE 😊)
Choose an amount
Or enter a custom amount
Your contribution is appreciated.
Other Posts from OptionsTradesByDamocles
This Week’s Market Sentiment
This Market Sentiment Section is typically completed by midday Monday morning. By the time this journal is published, it will be a week old.
(As of 05/24/2021)
In this section, I review five indicators: VIX, Put/Call Ratio, S&P 500, Consumer Sentiment Index, and Geopolitical events that could affect the market’s direction. I will use these indicators to help guide my trading decisions for this week.
Geopolitical Tree-Shakers (GTS):
GTS is like a lit fuse to a bomb. The fuse can be fast or slow, and the bomb can easily be a dud. But I need to watch this closely as an indicator. The GTS can significantly disrupt all the other indicators at the drop of a hat.
- Cryptocurrency in a correction
- Biden lowers the price tag for the Infrastructure bill & Republican Senate counteroffer
- Rising interest/inflation rates will be a continued background pressure for some time
- Israeli/Palestinian conflict continues – whatever happened to the Abraham Accord under Biden?
- States are ending federal unemployment benefits early
- Mega retailers, like Walmart and Home Depot, will be releasing their earnings this week
- National Association of Home Builders sentiment index to be released Monday morning, housing starts on Tuesday, and existing home sales on Friday
- CDC revises mask recommendations
Inflation has now become the consensus of the Marketeers and will weigh heavily on the markets for the next several months. This Friday, the US Bureau of Economic Analysis is expected to show a 3.5% increase in PCE for April. I don’t see this as sending the markets into a bear cycle but just as an impediment to growth.
Bitcoin has taken it on the chin last week, I and expect it will fall deep into correction territory before it is over. While Bitcoin (and cryptocurrencies in general) were a fad, speculation ran ramped and unchecked. But now that it is getting some stated legitimacy from major economic powers (US and China) the fear of heavy-handed regulation is highly possible. Last week, China enacted several heavy banking restrictions governing Bitcoin, sparking a 30% plunge in one day. This weekend the selloff continued for another 13%. (Any seismic event that happens in one spot of the Stock Markets, will start a Market-Stampede. I expect that many unrelated assets will feel the brunt of Crypto-Correction in the short term, but this should bounce back.)
The Democrat’s $2.3 trillion dollar infrastructure bill is thankfully hitting heavy resistance in Congress. The Biden Administration lowered the amount to $1.7T but that too was rejected (not just by all the republicans but more importantly by a large group of fiscal conservative Dems). The Republican Senate sent a $1T counteroffer to the White House Thursday. The continuing saga of the outcome of this legislation will keep a high degree of uncertainty in the market’s performance. These negotiations will keep the Marketeers rattled for a while.
COVID Stimulus is fading away and many States are opting out early from the enhanced unemployment benefits. So the rocketing Consumer Spending of the past could of months is petering out. This petering is going to force Marketeers to reevaluate the future earnings of mega-retailers and lower growth estimates.
This week’s GTS outlines several disturbing market-plays that can keep many Marketeers on the sidelines for weeks, if not months. But none of this should translate into a sustained negative to the broader markets. I would expect over the next several weeks that Thrashing will be the biggest market activity. So based on this week’s GTS alone, I will initially set the DEFCON (Damocles Options Trading Readiness Signal) to 4 (but will hold my breath).
Setting DEFCON to 4
VIX: Broad Market Volatility
The VIX is an emotion-gauge for the general investing population. It is thought to be driven by the Marketeers’ current level of greed or fear. As one-month forward-looking volatility, it is not designed to tell us which direction the market will be going, but more of how fast it can get there.
A VIX of 15% is assumed to be a market at rest. But since the intrinsic nature of the Stock Market is to move up, the markets with a VIX closer to 15% or below will have an innate tendency to rise.

The 1-month Regression Channel for the VIX continued on its bullish trajectory – bad for assets but good for premiums. The Marketeers appear to struggle for a direction because of the contrary economic reports.
The VIX ended last week at 20.2%, higher than the week before at 18.1%.
Market jitters continue to rise for the near term as the Marketeers continue to digest the first true Biden economic numbers.
Due to the change of VIX trajectory, I am downgrading the DEFCON to 3. Let see if the following indicators will change that level.
Maintaining DEFCON = 3
Put/Call Ratio:
Put Options are frequently used as protection against existing investments falling. When the ratio between Put Options bought versus Call Options bought is above 1, then this is an indicator that the Marketeers are buying insurance to what they may see as declining Markets. Conversely, when the Put/Call Ratio falls below 1, then there is a general sense that the broader Markets will increase, and more investors are buying more than selling.
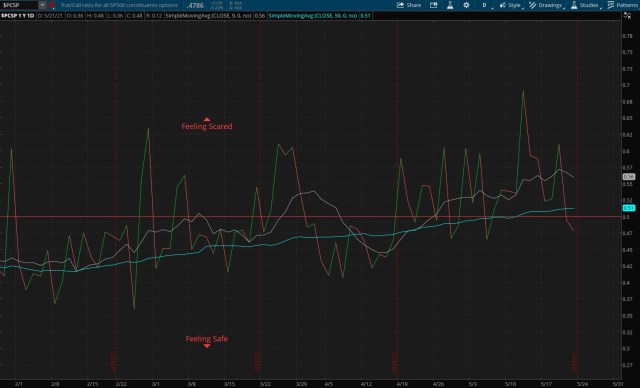
The ratio ended last week below the .5 line – a good sign. But both the 9-Day and 50-Day SMA are above the jitter-line. This implies that the trend is still moving scared.
(Even though the P/C Ratio over the past month averaged above the .5 line, it is still far below the “Head for the Hills” 1.0 line.)
The steady rise in the 50-Day SMA signals rising jitters. So far, the GTS, VIX, and this P/C Ratio appear to be a response to worse-than-expected economic news.
Maintaining DEFCON = 3
Consumer Sentiment Index (CSI):
I’m searching for a new Consumer Sentiment Index (CSI) chart as provided by the University of Michigan.
A low CSI index is a general dissatisfaction with our current management of U.S. economic policies. This dissatisfaction will imply that something has to change. A high satisfaction rating suggests approval of the current policy management and implies market stability.

This week’s CSI has not been updated since last week. The preliminary May index shows the CSI falling to 82.8 from April’s final of 88.3. This is not good news for the Biden Economic Policies. Rising Inflation is signaling higher prices, and the rising unemployment (low employment) suggests that supply shortages may continue (creating a feedback loop of higher prices for demand products).
This CSI continues to illustrate the jitters showing in the VIX and P/C Ratio, Nothing here suggests raising the DEFCON level.
Maintaining DEFCON = 3
Market Indexes:
DOW (DJX) = 34,208 – down 0.5% from 34,382 last week. (4 week deviation: 283 mostly flat from 292 last week)
S&P 500 (SPX) = 4,156 – down 0.4% from 4,174 last week. (4 week deviation: 36.82 mostly flat from 35.4 week)
The S&P 500 is a stock market index that tracks the 500 largest companies in the U.S. This index represents about 80% of all the capitalization for the country. The S&P is widely considered the best indicator of how all the U.S. markets are performing.

Market Thrashing
4-Week Thrashing of DJX = +/- 283 points or 3.8% of the market’s volume is flat from 0.8% last week.
4-Week Thrashing of SPX = +/- 36.82 points or 3.4% of the market’s volume is flat from 0.8% last week.
The Indexes thrashing below 1.x% is indicating a steady-hand market. With the thrashing for both the DOW and S&P above 3%, I can expect abrupt directional changes. But, since the S&P 500 and DOW’s 4-month trend trajectory is bullish, there is no reason to believe that will change. (However, the 1-month trajectory for the S&P 500 has been aggressively bearish.)
The Markets ended last week slightly below how it started. This is continuing the bear direction from the previous week.
The Trend Channel has not changed much for the past four months, with thrashing and trajectory about the same.
The short-term market data is now agreeing with the GTS, VIX, and P/C Ratio that general jitteriness is on the rise. But this movement follows recent similar movements but continues to maintain a Bullish trajectory. I do not think all this will pull the markets down into bear territory.
I will predict that the markets will move primarily sideways. I will upgrade the DEFCON level at 4 but keep my eyes open for early opportunities.
Maintain DEFCON = 4
My sentiment for this coming week:
Of the five indicators:
- the GTS is listing some sustainable angst – Shrug
- the VIX continues to exhibit rising concern by the Marketeers – BOO
- the P/C Ratio shows that a growing number of Marketeers are continuing to bet on a market pull-back – BOO
- the CSI screams a falling sentiment of the current economy – BOO
- the Market Movement continues to stay overall bullish but slowing – YEAH
I feel the markets have a higher potential to move mostly sideways over the next could of weeks.
Trading Readiness Level for this week
DEFCON = 4 (but with an attitude!)
This week, I will focus on:
Because I feel like I’m on the borderline between DEFCON 3 and 4 –
- One spread late in the week totaling < $2.5K risk) as the Markets see fit
- Spread term of 8-weeks or less
- Probability of OTM > 80%
Profit and Loss Statement
(As of 05/21/2021)
Balance Sheet
| Year 2021 | Month May | Week #21 | |
| Beginning Account Balance | $16,000.00 | $17,453.03 | $17,951.91 |
| Deposits (Div. & Int.) | $0.50 | $0.00 | $0.00 |
| Withdraws (paycheck) | -$1,500.00 | -$300.00 | -$300.00 |
| Premiums on Open | $3,602.01 | $674.00 | $160.00 |
| Premiums on Close | -$242.00 | -$9.00 | -$0.00 |
| Fees Paid (total) | -$49.62 | -$7.14 | -$1.02 |
| Ending Account Balance | $17,810.89 | $17,810.89 | $17,810.89 |
| Total Gain/Loss | $1,810.89 | $357.86 | -$141.01 |
| ROR | 2.1% | -0.8% | |
| ROC | 11.3% |
Progress Graph

(Note: the negative weekly results for weeks 4, 8, 12, 17, and 21 are when I withdrew $300 from the Trading Account for my paycheck.)
My Performance vs. SPY
Hypothetically, instead of depositing $16,000 in my Options Trading Account, could I have done better if I bought $16,000 of the ETF/SPY instead?
| Options Trading | SPY (Fictional) | |
| Initial Investment (As of Jan 4, 2021) | $16,000 (Cash) | $16,000 (43.39 shares @ $368.55) |
| Funds Added | $3,602.51 (Premiums) | 0.31 shares (Dividends Reinvested) |
| Funds Removed | -$291.62 (Early Close & Fees) | $0 (Fractional Shares Sold) |
| Ending Balance | $19,310.89 (Cash) | $18,384.94 (43.70 shares * $420.76 CV) |
| ROI | +20.7% | +14.9% |
Schedule for this Week
Goals for this week: (05/24/2021 – 05/28/2021) (Week #21)
- Document lessons learned or new thoughts
- Open one or two wide-strike spread
- Update Trading Log as trades occurs
Monday:
- Determine/update this week’s market sentiment section
- Calculate/record Put/Call Ratios for all stocks on the watch list
- Review/tweak Trend-Channels for all stocks in the watch list
- Set target expiration dates for all options as follows:
- Bull Credit Spreads: Jul 16 (6-8 weeks)
Note: If there are no Options Chains published for the 8-week expiration, then use the next Options Chain down from 8-weeks (7-weeks, 6-weeks). Beyond 4-week expirations, only the monthly chains are available to trade.
- Bull Credit Spreads: Jul 16 (6-8 weeks)
- Look up Ex-Dividend dates for positions in/approaching ITM (MarketWatch/Calendar)
- Stage possible trades for all watch list stocks by 10:00 AM
- NO TRADING BEFORE 10 AM. (Let the Market find its direction after the weekend.)
- Watch one Webcast or take one online mini-course to be completed by Friday.
Tuesday – Thursday:
- Review how yesterday’s staged trades moved. Adjust premiums to take advantage of movements.
- Submit a couple of Spreads, but keep a close watch. If one is accepted, cancel the others (we want only one new active trade per day).
- Be mindful of Entry Rules.
Friday:
- Review the total technical dollars at risk for this week. If significantly below $500, then submit additional spreads if prudent.
- Update and post weekly journal (this blog) with any lessons learned or strategy changes.
This Week’s Trade Activity
(As of 05/28/2021)
Spread Count Summary:
| Year 2021 | Month May | Week #21 | |
| Vertical Bull Put Credit Spread | 34 | 6 | 1 |
| Vertical Bear Call Credit Spread | 0 | 0 | 0 |
| Vertical Bull Put Debit Spread | 0 | 0 | 0 |
| Vertical Bull Call Debit Spread | 0 | 0 | 0 |
| Margin Interest | 1 | 0 | 0 |
| Total | 35 | 6 | 1 |
Current Dollars at Risk:
| Year 2021 | Month May | Week #21 | |
| Vertical Bull Put Credit Spread | $11,121. | $8,826. | $2,340. |
| Vertical Bear Call Credit Spread | $0. | $0. | $0. |
| Vertical Bull Put Debit Spread | $0. | $0. | $0. |
| Vertical Bull Call Debit Spread | $0. | $0. | $0. |
| Iron Condor | $0. | $0. | $0. |
| Total Dollar Risk | $11,121. | $8,826. | $2,340. |
| Max Risk Allowed | $16,000.00 | $8,000 | $2,500. |
New Positions Opened This Week
(05/24/2021 – 05/28/2021)
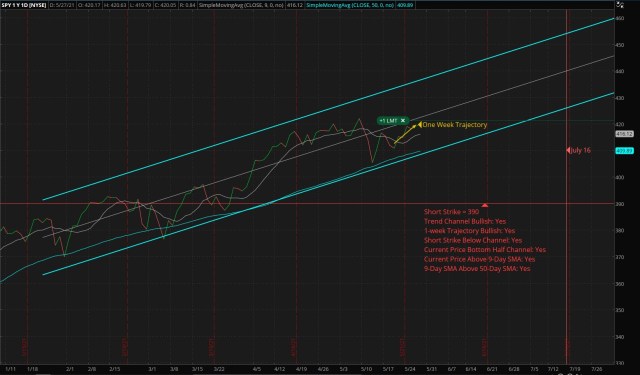
SPY: 390p/365pp – Open 05/27/21 – Expires 07/16/21 – Max Gain = $160.00 – Open Price = $420.24
(Vertical Bull Put Credit Spread)
At Open: Prob. OTM=81.4%, Headroom=-7.2%, Max Loss=$2,340.00, ROC 6.8%, 50d Dev = $3.79
Entry Rules for Vertical Bull Put Credit Spreads:
- Current maximum dollars at risk < $16,000? Yes ($11,121)
- Max dollar at risk this week < $2,500? Yes ($2,340)
- Max time to have any dollars at risk < 8 weeks (<56 days)? Yes (50 days)
- Long-term trend (four months) bullish? Yes (see chart)
- Short-term trajectory of the underlying bullish? Yes (see chart)
- Put/Call Ratio < 1, (or falling if it is > 1)? Yes (0.9)
- Current price above 9-Day SMA?: Yes (see chart)
- 9-Day SMA above 50-Day SMA?: Yes (see chart)
- Short-strike < 1 SD below the current price? Yes (1SD=393.14)
- Short-strikes Prob-OTM > 80%? Yes (81.5%)
- Short-Strike price below the trend channel at expiration?: Yes (see chart)
- Current price within the bottom 1/2 of Trend Channel?: Yes (see chart)
- Long-strike at maximum width (>= 10)? Yes (25 strike width)
Set a GTC Conditional Trailing Stop Limit (CTSL): (Not Set)
The broader markets have mostly moved sideways over the past 30 days. The other assets in my watchlist show flat to negative short-term movement. SPY and DIA were the only prospective underlying assets that continue to have a growth profile.
SPY: 120-day trend bullish (@40 degrees higher from flat). Thrashing (210 days) = 3.3%
QQQ: 120-day trend is mostly sideways. The channel tilts up, but not by much. Thrashing (120 days) = 3.0%
IWM: 120-day trend is mostly sideways. The channel tilts up a little. Thrashing (120 days) = 2.5%
DIA: 120-day trend bullish (@45 degs higher from flat). Thrashing (120 days) = 3.8%
Trades Currently Cooking
(As of 05/28/2021)
QQQ: 295p/280pp – Open 05/21/21 – Expires 07/02/21 – Max Gain = $104.00 – Open Price = $329.59
(Vertical Bull Put Credit Spread)
At Open: Prob. OTM=84.8%, Headroom=-10.4%, Max Loss=$1,396.00, ROC 7.4%, 42d Dev = $7.19
Now: Prob. OTM=90.2%, Headroom=-11.7%, IV%=4.8%
DIA: 315p/305pp – Open 05/21/21 – Expires 07/02/21 – Max Gain = $60.00 – Open Price = $343.45
(Vertical Bull Put Credit Spread)
At Open: Prob. OTM=85.7%, Headroom=-8.3%, Max Loss=$940.00, ROC 6.3%, 42d Dev = $2.86
Now: Prob. OTM=90.5%, Headroom=-8.8%, IV%=4.0%
SPY: 365p/345p – Open 05/13/21 – Expires 06/30/21 – Max Gain = $138.00 – Open Price = $408.94
(Vertical Bull Put Credit Spread)
At Open: Prob. OTM=83.2%, Headroom=-10.6%, Max Loss=$1,862.00, ROC 7.4%, 48d Dev = $8.18
Now: Prob. OTM=94.8%, Headroom=-13.2%, IV%=6.4%
DIA: 325p/315p – Open 05/07/21 – Expires 06/18/21 – Max Gain = $81.00- Open Price = $347.06
(Vertical Bull Put Credit Spread)
At Open: Prob. OTM=83.3%, Headroom=-6.4%, Max Loss=$919.00, ROC 8.7%, 42d Dev = $4.23
Now: Prob. OTM=89.6%, Headroom=-6.0%, IV%=4.0%
QQQ: 297p/282p – Open 05/05/21 – Expires 06/18/21 – Max Gain = $131.00- Open Price = $329.06
(Vertical Bull Put Credit Spread)
At Open: Prob. OTM=82.7%, Headroom=-9.8%, Max Loss=$1,369.00, ROC 9.5%, 44d Dev = $9.88
Now: Prob. OTM=93.8%, Headroom=-11.1%, IV%=5.2%
IWM: 205p/190p – Open 04/28/21 – Expires 06/18/21 – Max Gain = $134.00- Open Price = $228.03
(Vertical Bull Put Credit Spread)
At Open: Prob. OTM=80.9%, Headroom=-10.2%, Max Loss=$1,366.00, ROC 9.7%, 51d Dev = $5.12
Now: Prob. OTM=90.1%, Headroom=-9.0%, IV%=1.1%
IWM: 205p/195p – Open 04/29/21 – Expires 06/04/21 – Max Gain = $70.00- Open Price = $227.79
(Vertical Bull Put Credit Spread)
At Open: Prob. OTM=84.8%, Headroom=-9.9%, Max Loss=$930.00, ROC 7.4%, 36d Dev = $4.11
Now: Prob. OTM=97.8%, Headroom=-9.1%, IV%=0.7%
Trades Closed This Week
(As of 05/28/2021)
DIA: 320p/310p – Open 04/21/21 – Expires 05/28/21 – Max Gain = $75.00- Open Price = $340.69
(Vertical Bull Put Credit Spread)
At Open: Prob. OTM=84.1%, Head Room=-6.1%, Max Loss=$925.00, ROC 8.0%, 36d Dev = $5.40
At Close: Prob. OTM=99.3%, Head Room=-7.5%, IV%=2.9%, ROR= 8.1%
SPY: 390p/375p – Open 04/21/21 – Expires 05/28/21 – Max Gain = $107.00- Open Price = $415.85
(Vertical Bull Put Credit Spread)
At Open: Prob. OTM=82.3%, Head Room=-6.2%, Max Loss=$1,393.00, ROC 7.6%, 37d Dev = $9.65
At Close: Prob. OTM=99.8%, Head Room=-7.2%, IV%=0.0%, ROR= 7.7%
IWM: 205p/195p – Open 04/16/21 – Expires 05/28/21 – Max Gain = $100.00- Open Price = $244.17
(Vertical Bull Put Credit Spread)
At Open: Prob. OTM=80.3%, Head Room=-8.5%, Max Loss=$900.00, ROC 11.0%, 42d Dev = $5.42
At Close: Prob. OTM=99.8%, Head Room=-9.2%, IV%=0.7%, ROR= 11.1%
QQQ: 310p/295p – Open 04/14/21 – Expires 05/28/21 – Max Gain = $125.00- Open Price = $339.95
(Vertical Bull Put Credit Spread)
At Open: Prob. OTM=82.4%, Head Room=-8.8%, Max Loss=$1,374.00, ROC 9.0%, 44d Dev = $10.35
At Close: Prob. OTM=99.9%, Head Room=-7.4%, IV%=2.7%, ROR= 9.1%
Conclusion
Disclaimer
Even though I have tried to make it clear that this blog is my journal, documenting my trek into Options Trading, it has been suggested by others that I, nevertheless, include a general disclaimer. So here goes…
“This blog and the information contained herein is not intended to be a source of advice or analysis concerning the material presented. The information and/or documents contained in the blog do not constitute investment advice.”


2 THOUGHTS ON “Custom Options Watchlist using Thinkorswim in Excel – PT 2”