

A WOPR of a game! This week’s commentary is to review why I should avoid the WOPR’s Stop Loss strategies for my Vertical Bull Put Credit Spreads, and when is the right time to use ThinkorSwim’s simple Trade Triggers. – Misery Index continues to rise.
Table of Content
– Stephen Falken: The whole point was to get the computers to learn from mistakes we couldn’t afford to make. Except, I never could get the WOPR to learn the most important lesson.
– (Movie: War Games)
– David Lightman: What’s that?
– Stephen Falken: Futility. That there’s a time when you should just give up.”
(Slight clarification by Damocles)
ThinkorSwimTrade Stop-Loss WOPRs

Shortly after my devastating losses from the COVID Crash in 2020, I felt VERY motivated to research Stop-Loss mechanisms. I wanted to know how to program my ThinkorSwim Trading Platform (aka The WOPR) to automatically monitor price changes and exit risky positions before I lose money. This methodology works well on my long-term, buy-and-hold portfolio, so why would it not work equally well here?
This week’s commentary is to review why I should avoid the WOPR’s Stop Loss strategies for my Vertical Bull Put Credit Spreads, when is the right time to use ThinkorSwim’s simple trade triggers, and how should I confront a brutal bear market.
Commentary Contents
- Why Avoid Stop-Loss Strategies
- Best Time To Use ThinkorSwim’s Trade Triggers
- Stop-Loss Alternatives
- Conclusion
In the three 2020 posts below, I looked into Stop Limits, Trailing Stop Losses, and Conditional Trailing Stop Limits. These posts documented when I can use these strategies and how to program ThinkorSwim to schedule them.
All of these Stop-Loss triggers are attempts to mitigate losses in a falling market.

And all of these have failed me.
Why Avoid Stop-Loss Strategies
I lost a lot of cash at the onset of the 2020 COVID Crash as many of my open spreads closed at max-loss. I also unwittingly lost cash on the recovery as many of my newly discovered Stop Loss triggers exited early at high losses. But more germane, I lost a lot of cash because I was a very naive trader. The Vertical Spreads that I was entering at that time were too narrow, too short-term, and too high-risk.
Velocity of Price Changes
During times of high market volatility, the premium value of my open spreads can have high thrashing rates. So, setting a closing order trigger on the premium value of a Spread can be dangerous. The velocity of premium price changes can be huge – and momentarily. Thus, trade triggers can get inadvertently activated during times of wild premium price swings.
Time Value
Time value is the portion of an option’s premium that is attributed to the time remaining until the expiration (pedantically called extrinsic value). This is money that is above and beyond the intrinsic value of the open spread. And the value of that remaining time is a function of the volatility of the underlying asset.
Executing a closing order on a Vertical Spread early will carry the added cost of “Time-Value.” The earlier I close the Spread, the more the time value. Additionally, the higher the volatility of the underlying, the higher the time value. So closing a highly volatile Spread early will cost me a lot more than if I waited a couple of days.
Gapping
In my post “Predator Investor” I have a section titled “Is my Conditional Trailing Stop Limits working against me?”
“Gap-down” is a market phenomenon when there is a momentary drop in the underlying value due to a variety of conditions. It can happen when a major institutional investor makes a significant reclassification of the underlying asset, or it can just be a market clitch. The point is gapping does happen.
When there is a gap-down, there is an instantaneous drop in the underlying’s asset value. Moments later, that underlying will then bounce back just as quickly. Thus the drop from the gap-down can fall well below any Conditional Trade settings I have programmed in ThinkorSwim, which will automatically enter a limit order, which can then trigger the closing order. The end result is that I just exited a Vertical Spread at max-loss when in reality it still had an > 80% probability of OTM.
Best Time To Use ThinkorSwim’s Trade Triggers
From my chair, ThinkorSwim Trade Triggers are best used in an aggressive Bull Market. They appear to be counterproductive when the bears are tumbling.
Winners Exit Early
If I open a new Vertical Bull Put Credit Spread with an 8-week expiration date, and after 4 weeks, I have already achieved 90% of my max gain, closing 4 weeks early will have these benefits:
- Greatly improved my AROR for that position.
- Release my set-aside cash for that position.
- Give me the opportunity to open a new 8-week Vertical Spread sooner.
- No longer at risk of a sudden market downturn.
How to Set Simple Trade Triggers in ThinkorSwim
The first step in programming a closing-order trade trigger is to determine the premium price I am willing to close with. Typically, I will set a closing schedule under this week’s “Exit Rules.”
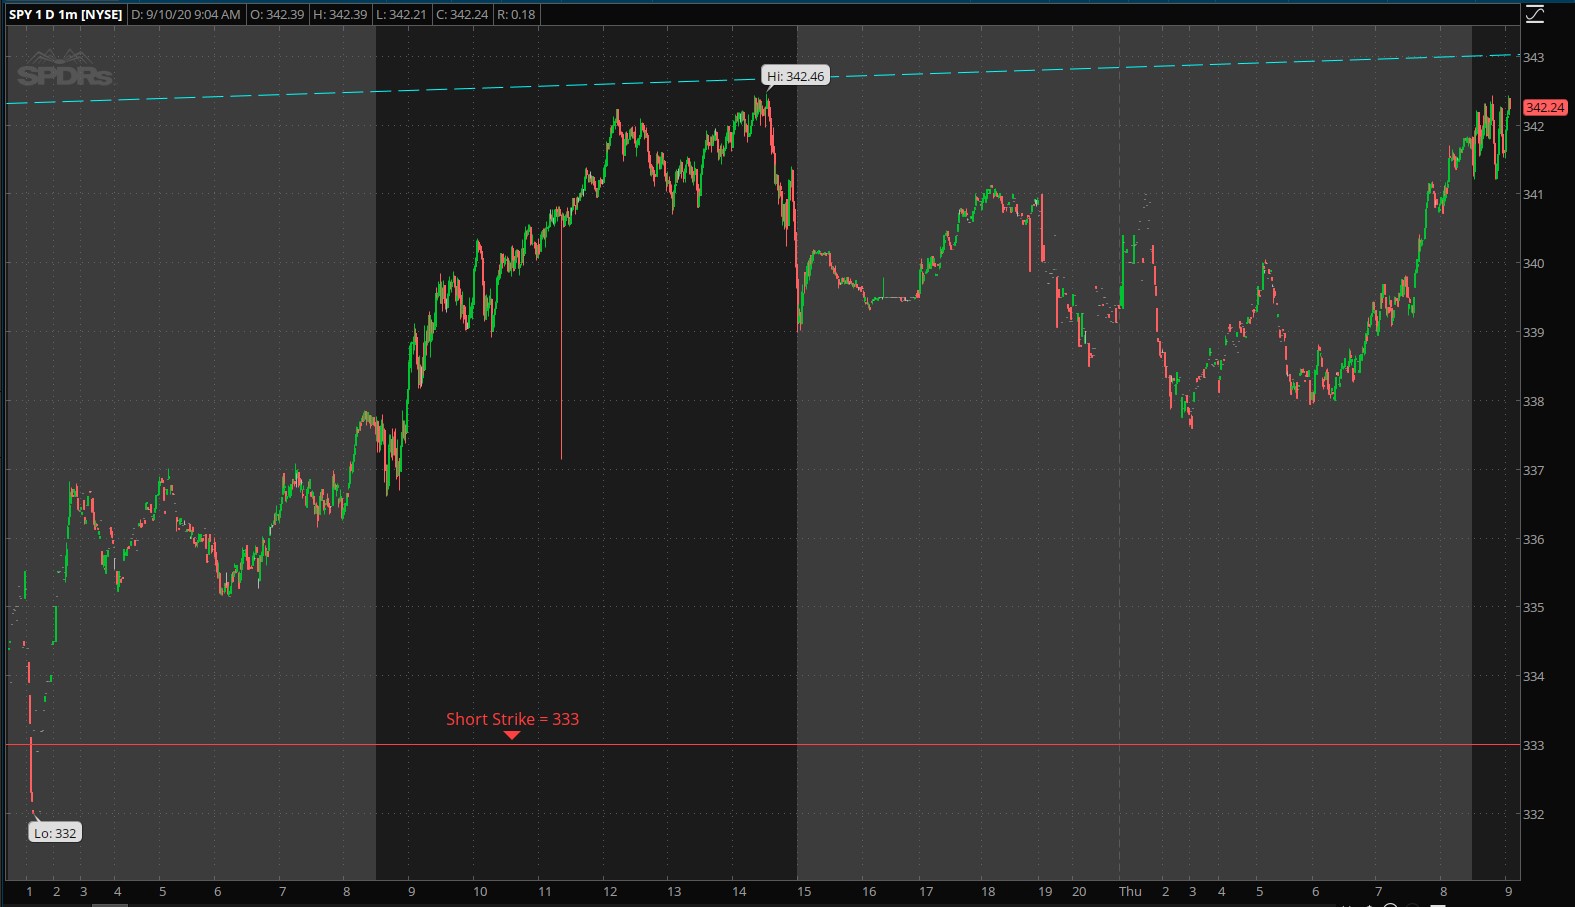
Reference Spread:
SPY:380p/360p – Open 03/03/22 – Expires 04/22/22 – Max Gain = $142.00 – Open Price = $438.66
This Spread is more than 4 weeks to expiration, so I will want to exit once I reach 85% of max-gain or when the closing price is $0.21 or less ($1.42 * (1 – 0.85) = $0.213).
For a better explanation of when to exit a winning Vertical Spread, see my post “Exit Rules: Vertical Credit Spreads – Pt 1.”
Setting a Simple Trade Trigger in ThinkorSwim:
- In my ThinkorSwim Trading platform, open the “Monitor” tab to list all my open spreads.
- Expand the Options Contract list under the Spread’s underlying. In this example, “SPY.”
- Select (highlight) the Spread I want to set a closing-order trigger by left-clicking one leg, then shift left-clicking the other leg. Make sure I selected both the Short and Long contract pair.


Once the desired Spread is selected, right-click on the highlighted pair and navigate to “create closing order”, then to the option “Buy +1 Vertical Spy…” Be sure to select the option containing “VERTICAL” and not the individual contracts.
Once selected, I will enter my desired exit price of $0.21 and select Good till Close (GTC).
Next, I will click the “Confirm and Send” button below.


Once the confirmation dialog box is displayed and I confirm the closing-order trigger, I will click the “Send” button.
Finally, I will see the working closing order.

Stop-Loss Alternatives
I suck at market-timing! Lesson learned and I have the bruises to show for it.
There are only two classes of people who engage in market-timing; those who have a million-dollar research department to analyze every nuance of the markets and newbs. Everyone in between won’t even try.
So my ability to predict a market direction change cannot be any skill to bank on. My best chance of mitigating a market correction is to be a wiser investor. And being wise means:
Trade the Trend
Follow the Marketeers. Institutional investors are the few that steer the markets. They are master manipulators and greedy bastards. But their primary goal is to make money. So if I can follow them, then I should make money as well.
Posts to help me understand this:
Trend Trading Using TOS Regression Channel
How To Make Loss Resistant Vertical Spreads – Market Force
Engage Only in Loss-Resistant Spreads
Loss-resistant Vertical Spreads are Vertical Bull Put Credit Spreads that can generate a modest income during most market conditions. They have the maneuvering room to react to unexpected market downturns and yet still make money. Loss-Resistant Spreads will not get me rich quickly but will help me mitigate losses if the markets unexpectantly go sour.
Some helpful posts for understanding Loss-Resistant Spreads are:
How To Make Loss Resistant Vertical Spreads – Strike Width
How To Make Loss Resistant Vertical Spreads – Short Strikes
How To Make Loss Resistant Vertical Spreads – Market Force
How To Make Loss Resistant Vertical Spreads – Expiration Dates
How To Make Loss Resistant Vertical Spreads – Underlying Assets
Learn to Roll Vertical Spreads
Being Loss-Resistant can only take me so far. In times like the 2020 Covid Crash or the 2022 Market Correction, I may still need to react to severely losing Spreads. And one way to respond is to learn to roll losing Vertical Spreads.
Rolling Vertical Spreads will close one Spread and then open another with a more favorable construction – in one ThinkorSwim transaction. Rolling is not the solution to a falling market but can help reduce cash losses early. See my post:
“How To Roll A Vertical Spread In ThinkorSwim.”
Conclusion
A strange game.
– Joshua (W.O.P.R) (Movie: War Games)
The only winning move is not to play
Using automated Stop-Loss triggers to mitigate losing Spreads is a game that has serious consequences during times of high market volatility. I feel that it is far better to be prepared for high volatility than to engage it.
Was This Post Helpful?
Although blogging is great fun, any Donation/Tip will let me know if I am actually helping someone else.
(Plus, it helps pay to keep my website active 😉)
Choose an amount
Or enter a custom amount
Your contribution is appreciated.
Other Posts from Options Trades By Damocles
This Week’s Market Sentiment
This Market Sentiment Section is typically completed by midday Monday morning. By the time this journal is published, it will be a week old.
(As of 03/06/2022)
This section reviews five indicators: VIX, Put/Call Ratio, S&P 500, Consumer Sentiment Index, and Ecopolitical events that could affect the market’s direction. I will use these indicators to help guide my trading decisions for this week.
Each of my five indicators will “vote” on a DEFCON (Damocles Options Trading Readiness Signal) level, exclusive to that indicator. Then, In the final sub-section, “My sentiment for this coming week” below, I’ll compile the votes into a DEFCON level for the week.
Ecopolitical Tree Shakers (ETS):
Ecopolitical (Sociopolitical-Economics) Tree Shakers (ETS) can be breaking news, political machinations, Federal Reserve musings, or even Twitter Trends. They are events that can abruptly change the dynamics of the current markets. U.S. political polarization’s impact on Wall Street cannot be glossed over.
ETS is like a lit fuse to a bomb. The fuse can be fast or slow, and the bomb can easily be a dud. But I need to watch this closely as an indicator. The ETS can significantly disrupt all the other indicators at the drop of a hat.
- Russia/Ukraine overshadowing financial news – Yikes
- Inflation continues to rise, now up 7.9% from Feb 2021 – Yikes
- More pain to come on Interest rates increase – Yikes
- WTI Oil blow through $120/bbl (national average for gas > $4.0, highest since 2008) – Yikes
- US issues Russia oil embargo – Shrug
- Solid jobs growth of 678,000 new jobs – Yay
- Unemployment’s modest fall to 3.8% – Yay
- A surreal lack of partisan bickering in Congress – Yay
Geopolitical
Heavy-handed sanctions on Russia will deprive the US markets of many growth opportunities. And if the US decides to ban Russian oil imports, expect energy prices to skyrocket. Sanctions and exploding oil prices are not going to help lower our historic inflation rate.
Lots of effort is being made to keep the Russia/Ukraine conflict from erupting into another World War. Most of the Marketeers are staying to the sidelines in case this conflict escalates. As a sign of conflict jitters, oil prices have already moved higher.
Oil prices (Ticker: CL=F) are the commodity to watch. If WTI continues to rise, so is the global tension of WWIII. If WTI falls in big chunks, then the crisis abated.
Socioeconomics
In the short term, rising interest rates will make stuff more expensive and will put more pressure on corporate spending. This will come back as lower than expected growth later in the year.
February CPI took another hike (+0.8%).
Most ETS items appear to have legs. So what is depressing the markets now may continue to do so. But it also seems that we may have reached the bottom of the market correction and hopefully we won’t lose too much more ground over the next few weeks.
ETS votes optimistic DEFCON 3
VIX: Broad Market Volatility
The VIX is an emotion-gauge for the general investing population. It is thought to be driven by the Marketeers’ current level of greed or fear. As one-month forward-looking volatility, it is not designed to tell us which direction the market will move but rather how fast it can get there.
A VIX of 15% is assumed to be a market at rest. Since the intrinsic nature of the Stock Market is to move up, a VIX close to 15% or below will correspond with the market’s innate tendency to rise.

The 1-month trajectory of the VIX Regression Channel took an aggressive tilt-up as the Marketeers assessed the ETSs.
- Last week the VIX ended at 32.0%, a good leap from the previous week of 27.6%.
- The current VIX dropped shot above the 9-Day SMA, and the 9-Day SMA is well above the 50-Day SMA
- The 50-Day is 60% above the 15% and rising.
All VIX signs suggest we are in a time of high volatility and a high degree of market uncertainty – and the Marketeers hate uncertainty.
Volatility rises and Thrashing falls, could be a signal to expect lowering markets this coming week.
Being blind to all other indicators, I will vote for a DEFCON level 3
VIX votes a DEFCON 3
Put/Call Ratio:
Put Options are frequently used as protection against existing investments falling. When the ratio between Put Options bought versus Call Options bought is above 1, this is an indicator that the Marketeers are buying insurance for what they may see as declining Markets (or a pending Market collapse). Conversely, when the Put/Call Ratio falls below 1, there is a general sense that the broader Markets will increase, and more investors are buying more than selling.

- The S&P 500’s Put/Call Ratio spent most of last week in the “Good Shape” region
- The end of the week value of .74 is a goodly jump from 0.56 last week
- The 9-Day SMA startng a decline with the week’s ending value of 0.65
- Current ratio flew up above the 9-Day SMA, and the 9-Day is still above the 50-Day SMA
Last week’s Put/Call Ratio ended by flirting with the “Nervous” region. But staying mostly inside the “Good Shape” zone suggests that the Marketeers are not yet ditching their investments. The Put/Call Ratio indicator continues to be the shiny star in the otherwise dismal Market Sentiment section.
Being blind to all other indicators, I’ll vote for a cautious DEFCON 4
Put/Call Ratio votes a cautious DEFCON 4
Consumer Sentiment Index (CSI):
A low CSI index is a general dissatisfaction with our current management of U.S. economic policies. This dissatisfaction will imply that something has to change. A high satisfaction rating suggests approval of the current policy management and implies market stability. Surveys of Consumers (umich.edu)

February’s preliminary’s will be reported this Friday. These numbers are still at historic lows.
Continued low CSI numbers are confirmation of the general dissatisfaction with the government’s economic policies.
Being blind to all other indicators and just looking at this week’s CSI, I feel we should be extremely cautious.
Misery Index
With the copious amount of economic pressures throughout the nation this year (inflation, employment, interest rates, etc.), knowing what the Misery Index is and what direction the index is moving can cast a long shadow on Marketeer’s sentiment. Numbers are coming from the U.S. Bureau of Labor Statistics (bls.gov).
- Inflation Rate: rose 0.8% in Feb ’22. Now up to 7.9% from a year ago.
- Unemployment Rate: February rate = 3.8%. Slight drop from 4.0% in January
Misery Index = 11.7% (7.9% + 3.8%). Slightly up from 11.5% last month.
CSI votes a dismal DEFCON 3
Market Indexes:
DOW (DJX) = 33.615 – down 1.2% from 34,059 last week. (4 weeks deviation: 527 down from 741 last week)
S&P 500 (SPX) = 4,329 – down 0.8% from 4,385 last week. (4 weeks deviation: 60.49 down from 96.16 last week)
The S&P 500 is a stock market index that tracks the 500 largest companies in the U.S. This index represents about 80% of all the capitalization for the country. The S&P is widely considered the best indicator of how all the U.S. markets are performing.

Market Thrashing
4 Weeks Thrashing of DJX = +/- 527 points or 1.6% of the market’s volume is a significant drop from 2.8% last week.
4 Weeks Thrashing of SPX = +/- 60.49 points or 1.4% of the market’s volume is a significant drop from 2.2% last week.
(Market Thrashing above 1.0% might indicate indecision from the Marketeers.)
The 4-week Market Thrashing took a significant drop last week as the Russia/Ukraine fracas is starting to drag. But a 1% drop in the markets last week reaffirmed that “it ain’t over yet!”
- The 4-month trend continues decisively bearish
- The 4-week trajectory affirms the trend as bearish
- The 9-Day SMA and the 50-Day SMA continue running with the Bears
- Current value of SPX edged below the 9-Day SMA by the end of the week.
- Decrease Thrashing suggests the Marketeers are pretty much bottomed out.
All the trajectories are still pointing lower, but the 10-day (which I don’t watch) had made a bullish turn.
Being blind to all other indicators, I’ll go with an optimistic DEFCON 3.
Market Index votes an optimistic DEFCON 3
My sentiment for this coming week:
Of the five indicators:
- The ETS has systemic issues – optimistic DEFCON 3
- The VIX is on the rise (now above 30%) – DEFCON 3
- The P/C Ratio shows marginal good-shape – cautious DEFCON 4
- The CSI shows a consumer base not excited about our economic future – DEFCON 3
- The Market Indexes taking geopolitical hits – optimistic DEFCON 3
My indicators continue to suggest that we have been testing the bottom side of the January/February bruising over the past two weeks. But pressures of rising prices, interest rates, and the Russia/Ukraine issue are still putting a lid on any upward movement.
Any new Spreads this week still need to be an ultra-low risk.
Trading Readiness Level for this week
This week’s Rules:
With this week’s optimistic DEFCON 3, I’m going to maintain defensive vigilance.
I have one expiring Vertical Spread that looks to be in good shape (current price > 6% above the Short Strike, and the Short is > 90% prob-OTM). So I am not anticipating rolling anything this week.
Because I have rolled 6 Vertical Spreads, the availability of unallocated working capital is getting low (Options Buying Power). So I need to start rationing.
Entry Rules:
- Short Strike > 1SD below Current Underlying’s Price
- If 4-month Trend Channel is bearish, then -5 from Short Strike
- If 2-week trajectory is bearish, then another -5 from Short Strike
- If 1-Week trajectory is bearish, then another -5 from Short Strike
- If POTM is still < 85%, lower Short Strike until > 85%
- Max-risk < $2K (as the Markets see fit).
- Open 1 15-wide or 1 20-wide Strike-Width Spread.
- Spread term of 8 weeks or less.
Exit Rules:
- Early close following this schedule:
- 85% of max-gain if 4 or more weeks out
- 90% of max-gain if 3 or more weeks out
- 95% of max-gain if 2 or more weeks out
- Let expire if less than 2 weeks out
- Roll Spreads within 1 week of expiration if:
- Short Strike is ITM
- Short Strike < 0.5% and 1-week trajectory is bearish
- Short Strike < 55% POTM and 1-week trajectory is bearish
- Close rolled QQQs at $1 profit if it ever gets there.
- Set QQQ 350p/310p exp. 3/18 GTC Closing Order Trade Trigger to $0.39
- Set QQQ 360p/320p exp. 3/25 GTC Closing Order Trade Trigeer to $0.99
Profit and Loss Statements
(As of 03/11/2022)
Cash Balance Sheet
| Year 2022 | Month Mar | Week #10 | |
| Beginning Account Balance | $28,000.00 | $28,416.96 | $28,557.94 |
| Deposits (Div. & Int.) | $0.22 | $0.00 | $0.00 |
| Withdraws (paycheck1) | -$1,050.00 | -$0.00 | -$0.00 |
| Premiums on Open | $6,654.00 | $255.00 | $113.00 |
| Premiums on Close | -4,911.00 | -$0.00 | -$0.00 |
| Fees Paid (total) | -$23.52 | –$2.04 | -$1.02 |
| Ending Account Balance | $28,669.92 | $28,669.92 | $28,669.92 |
| Total Gain/Loss | $669.92 | 252.96 | $111.98 |
| ROR | 0.9% | 0.4% | |
| ROC | 2.4% |
Cash Flow Chart

(Note: the negative weekly results for weeks 4 and 8 were when I withdrew $525 from the Trading Account for my paycheck.)
My Performance vs. SPY
Hypothetically, instead of depositing $28,000 in my Options Trading Account, could I have done better if I bought $28,000 of the ETF/SPY instead?
| Options Trading Account | SPY (Fictional) | |
| Initial Investment (As of Jan 4, 2021) | $28,000.00 (Cash) | $28,000.00 (58.9523 shares @ $474.96) |
| Funds Added | $6,654.44 (Premiums) | 0.22 shares (Dividends Reinvested) |
| Funds Removed | -$4,934.52 (Early Close & Fees) | $0 (Fractional Shares Sold) |
| Market Changes | -$7,517.50 (Open Spreads’ Fair Market Value ) | -$2,819.35 (Gain/Loss) |
| Ending Balance | $22,202.42 (Mark-To-Market) | $25,180.65 (59.1706 shares * $425.56 CV) |
| ROI | -20.7% | -10.1% |
Note: The markets started 2022 terribly. But I still believe that it will end higher than it began. So if I can keep my at-risk Spreads safe until the markets start a slow trackback, then all this negative unrealized market value will reverse.
Schedule for this Week
Goals for this week: (03/07/2022 – 03/11/2022) (Week #10)
- Document lessons learned or new thoughts
- Open one or two wide-strike spread
- Update Trading Log as trades occurs
Monday:
- Determine/update this week’s market sentiment section
- Calculate/record Put/Call Ratios for all stocks on the watch list
- Review/tweak Trend-Channels for all stocks in the watch list
- Set target expiration dates for all Options as follows:
- Bull Credit Spreads: Apr 29, 2022 (6-8 weeks)
Note: If there are no Options Chains published for the 8-week expiration, then use the next Options Chain down from 8-weeks (7-weeks, 6-weeks). Beyond 4-week expirations, only the monthly chains are available to trade.
- Bull Credit Spreads: Apr 29, 2022 (6-8 weeks)
- Look up Ex-Dividend dates for positions in/approaching ITM (MarketWatch/Calendar)
- Stage possible trades for all watch list stocks by 10:00 AM
- NO TRADING BEFORE 10 AM. (Let the Market find its direction after the weekend.)
- Watch one Webcast or take one online mini-course to be completed by Friday.
Tuesday – Thursday:
- Review how yesterday’s staged trades moved. Adjust premiums to take advantage of movements.
- Submit a couple of Spreads, but keep a close watch. If one is accepted, cancel the others (we want only one new active trade per day).
- Be mindful of Entry Rules.
Friday:
- Review the total technical dollars at risk for this week. If significantly below $500, then submit additional spreads if prudent.
- Update and post weekly journal (this blog) with any lessons learned or strategy changes.
This Week’s Trade Activity
(As of 03/11/2022)
Spread Count Summary:
| Year 2022 | Month Mar | Week #10 | |
| Vertical Bull Put Credit Spread | 15 | 2 | 1 |
| Vertical Bear Call Credit Spread | 0 | 0 | 0 |
| Vertical Bull Put Debit Spread | 0 | 0 | 0 |
| Vertical Bull Call Debit Spread | 0 | 0 | 0 |
| Margin Interest | 0 | 0 | 0 |
| Total | 15 | 2 | 1 |
Current Dollars at Risk:
| Year 2022 | Month Mar | Week #10 | |
| Vertical Bull Put Credit Spread | $18,904. | $3,745. | $1,887. |
| Vertical Bear Call Credit Spread | $0. | $0. | $0. |
| Vertical Bull Put Debit Spread | $0. | $0. | $0. |
| Vertical Bull Call Debit Spread | $0. | $0. | $0. |
| Iron Condor | $0. | $0. | $0. |
| Total Dollar Risk | $18,904. | $3,745. | $1,887. |
| Max Risk Allowed | $28,000. | N/A | $3,500. |
Options Buying Power:
Unallocated dollars available to open new Vertical Credit Spreads:
| Current Cash Balance | $28,669.92 |
| Set-Aside Dollars for Existing Spreads | -$24,000 |
| Cash Available for New Spreads | $4,669.52 (Options Buying Power) |
Vertical Spreads Opened This Week
(03/07/2022 – 03/11/2022)
DIA:290p/270p – Open 03/11/22 – Expires 04/29/22 – Max Gain = $113.00 – Open Price = $438.66
(Vertical Bull Put Credit Spread)
At Open: Prob. OTM= 86.0%, Headroom= -13.1%, Max Loss= $1,887, AROR= 44.2%

Entry Rules for Vertical Bull Put Credit Spreads:
- Current maximum dollars at risk < $28,000? Yes ($18,904)
- Max dollar at risk this week < $3,500? Yes ($1,887)
- Max time to have any dollars at risk < 8 weeks (<56 days)? Yes (49 days)
- Long-term trend (four months) bullish? No (see chart)
- Short-term trajectory of the underlying bullish? Yes (see chart)
- 2-week Thrashing < 1% & Bullish: No (2-week Thrashing = 1.3% / Bearish)
- Put/Call Ratio < 1, (or falling if it is > 1)? No (2.0 up from 1.5)
- Current price above 9-Day SMA?: Yes (see chart)
- 9-Day SMA above 50-Day SMA?: No (see chart)
- Short-strike > 1 SD below the current price? Yes (1SD=$300.09)
- Short-strikes Prob-OTM >= 85.0%? Yes (86.0%)
- Short-Strike price below the trend channel at expiration?: Yes (see chart)
- Strike Width minimum (>= 15)? Yes (20 strike width)
I waited until Friday to open this Spread. The market’s temperature is still at high risk, but the past few weeks seem to be settling. The Short Strike is still > 10 Strikes below the 1SD value.
By the time this Spread reaches expiration, it would have been four months into this correction – much longer than the normal correction cycle. So I am betting (at 85% POTM not too much) that we will be well on our way to a rebound.
Vertical Spreads Currently Cooking
(As of 03/11/2022)
As of this date, I have three positions currently at ITM.
SPY:380p/360p – Open 03/03/22 – Expires 04/22/22 – Max Gain = $142.00 – Open Price = $438.66
(Vertical Bull Put Credit Spread)
At Open: Prob. OTM=84.7%, Headroom=-13.5%, Max Loss=$1,858, AROR=55.4%
Now: Prob. OTM= 82.7%, Headroom=-11.1%
(Rolled) SPY:410p/380p – Open 02/23/22 – Expires 04/14/22 – Max Gain = $509.00 – Open Price = $430.68
(Vertical Bull Put Credit Spread)
At Open: Prob. OTM= 65.5%, Headroom= -4.8%, Max Loss=$2,491.00, AROR=148.9%
Now: Prob. OTM= 65.8%, Headroom=-4.1%
(Rolled) DIA:320p/290p – Open 02/24/22 – Expires 04/08/22 – Max Gain = $660.00 – Open Price = $2,340.00
(Vertical Bull Put Credit Spread)
At Open: Prob. OTM= 55.6%, Headroom= -2.0%, Max Loss=$2,491.00, AROR=239.1%
Now: Prob. OTM= 707%, Headroom=-4.5%
-ITM- (Rolled) QQQ:350p/310p – Open 02/14/22 – Expires 04/01/22 – Max Gain = $1,059.00 – Open Price = $349.53
(Vertical Bull Put Credit Spread)
At Open: Prob. OTM=46.8%, Headroom=+0.2%, Max Loss=$2,941.00, AROR=285.4%
Now: Prob. OTM=22.0%, Headroom=+5.2%
-ITM- (Rolled) QQQ:360p/320p – Open 02/08/22 – Expires 03/25/22 – Max Gain = $1,178.00 – Open Price = $353.65
(Vertical Bull Put Credit Spread)
At Open: Prob. OTM=40.4%, Headroom=+1.8%, Max Loss=$2,822.00, AROR=338.3%
Now: Prob. OTM=9.0%, Headroom=+8.0%
SPY:390p/370p – Open 02/04/22 – Expires 03/25/22 – Max Gain = $125.00 – Open Price = $446.66
(Vertical Bull Put Credit Spread)
At Open: Prob. OTM=85.9%, Headroom-12.7%, Max Loss=$1,875, AROR=49.3%
Now: Prob. OTM= 90.2%, Headroom=-9.0%
-ITM-(Rolled) QQQ:350p/310p – Open 01/25/22 – Expires 03/18/22 – Max Gain = $1,310.00 – Open Price = $442.47
(Vertical Bull Put Credit Spread)
At Open: Prob. OTM=40.6%, Headroom= +2.1%, Max Loss=$2,690, AROR=341.6%
Now: Prob. OTM= 12.5%, Headroom=+4.9%
Vertical Spreads Closed This Week
(As of 03/11/2022)
SPY:415p/395p – Open 02/02/22 – Expires 03/11/22 – Max Gain = $123.00 – Open Price = $455.27
(Vertical Bull Put Credit Spread)
At Open: Prob. OTM=84.5%, Headroom-8.8%, Max Loss=$1,877, AROR=64.1%
At Close: Prob. OTM=97.1%, Head Room=-3.2%, AROR= 64.1%
Cost to open: $1.23 premium collected * 100 shares = $123.00
(Net Profit= $123.00 to open – $0.00 to close – $1.00 fees = $122.00
AROR= ($122.00 / 37 days in play) *365 / $1,885 = 64.1%
The underlying for this Spread lost over 5% over its lifetime. The final week (this past week) I was getting worried that I may need to roll. Luckily, by mid-week, SPY (although through high thrashing) leveled.
Conclusion
Can selling options for income be considered a Home Business? Can I make money at home by selling Vertical Bull Put Credit Options Spreads? These are questions that I am trying to answer for myself.
Three years ago, I set out on a task to see if I could make a retirement income from home by trading Stock Options. I began with NO knowledge of Options mechanics and only $8,000 to risk. And because I learn best when I write things down, I have documented every step of the way (every bonehead mistake, process epiphanies, interconnecting events, externalities, and so on).
This blog is my Options Trading Journal. I will record my weekly Option Contracts buys and sells in hopes of gaining experience.
Experience is the ability to recognize that
– Damocles
I’m about to make the same mistake again.
Disclaimer
Even though I have tried to make it clear that this blog is my personal trading journal, it has been suggested by others that I, nevertheless, include a general disclaimer. So here goes…
“This blog and the information contained herein is not intended to be a source of advice or analysis concerning the material presented. The information and/or documents contained in the blog do not constitute investment advice.”


One THOUGHTS ON “Why Avoid ThinkorSwim Stop-Loss Strategies for Vertical Spreads”